
In the past few years, the US Supreme Court has handed down a number of high-profile decisions with a 5-4 majority. In the most recent term, these included the two gay-marriage cases Hollingsworth v. Perry and United States v. Windsor, as well as the voting-rights case Shelby County v. Holder. In the previous term there was one that was perhaps even more of a media event: the “Obamacare decision” in National Federation of Independent Business v. Sebelius.
With each 5-4 decision, people start to talk about how many 5-4 decisions there are, and people seem to think there are more of them than there used to be. There’s also talk about the increasing polarization of the court, because (according to the popular wisdom) so many decisions are not just 5-4, but the same 5-4, with the court divided into conservative and liberal factions that regularly vote en bloc. There seems to be a sentiment that these close decisions are somewhat undesirable, because they indicate a fragility in our system of government. (Or, as some might put it, they serve as uncomfortable reminder of how much influence Anthony Kennedy has on the law.)
Is this true? Are there really more 5-4 decisions than there used to be? Is the court really more polarized than it used to be? Every one of these is an. . . interesting question!!!
The data
I had wondered about this for a while, but I recently came across the Supreme Court Database, an online resource with complete information on all Supreme Court cases since 1946 — roughly 8300 cases. ((As yet I have been unable to find any easily processable source with data on all US Supreme Court decisions. If you know of one, do tell.)) Currently the database includes data through the 2011 term.
For every case decided by the court from the 1946 through 2011 terms, this database includes the votes of the justices as well as a variety of other interesting information that I didn’t really make use of. What I focused on was just a few facts: the votes of the justices and the size of the minority.
In all the discussion below, I excluded cases with tied votes. The database doesn’t seem to have enough information to tell which justices agreed with which others when the vote was tied (it just reports a tie vote). Also excluded were cases in which the individual votes of the justices aren’t available; these are typically “per curiam” decisions with no signed opinions.
How closely divided?
The size of the minority
It’s pretty simple to take this data and look at the proportion of cases that are 5-4. Actually what I did is I grouped the cases by the size of the minority. Looking at the size of the minority is pretty nearly the same thing as looking at the margin between the minority and the majority, but not quite. The reason it’s not quite the same is that there are some cases where not all 9 justices participate. Typically this is because a justice recuses themself.
The reason I grouped the cases by minority size rather than vote margin is that it more accurately captures the intuition that a unanimous decision is still “good” from the perspective of avoiding narrow decisions, regardless of how many justices participated in the decision. It turns out that there are a lot more unanimous decisions with recusals than close decisions with recusals.
Every case with a 4-justice minority is either a 5-4 decision or a 4-4 tie. A 4-4 tie can be considered just as “bad” as a 5-4 split if we want to avoid precarious results. There are some cases where the reverse is not true, but they are rare. That is, there are some cases where the majority has only one vote more than the minority, but the minority has less than 4 votes. In this data set, all of these are 4-3 decisions. This means only 7 justices participated, which is overall rather rare. On the whole, only about 3% of 1-vote-margin decisions were not 5-4 decisions.
However, when you look at unanimous decisions, the picture is different. Whereas you can’t get a 1-vote-margin-but-not-5-4 with more than 7 justices, you can get a unanimous decision with any number of justices. In fact, nearly 25% of the unanimous decisions in the data set are not 9-0. There are a fair number of 8-0 decisions, plus a few 7-0, and even a tiny number of 6-0 and 5-0 decisions. All of these are unanimous, but they have different “margins of victory”: a 9-0 vote has a margin of 9, an 8-0 has a margin of 8, etc.
What this means is that if you look at the size of the margin, you distort the picture of unanimous decisions considerably, because 25% of them aren’t 9-0. But if you look at the size of the minority, you don’t distort the picture of close decisions, because only 3% of close decisions are not 5-4. Because of this, I used the minority size rather than vote margin as my measure.
The results
This graphic shows the percentage breakdown of different minority sizes over time. The bars along the bottom indicate the tenures of the various justices. ((The tiny red bar at the far right is Sonia Sotomayor; there wasn’t enough room to fit her name in. Elena Kagan joined the court only in the 2010 term so her bar is too tiny to show.))
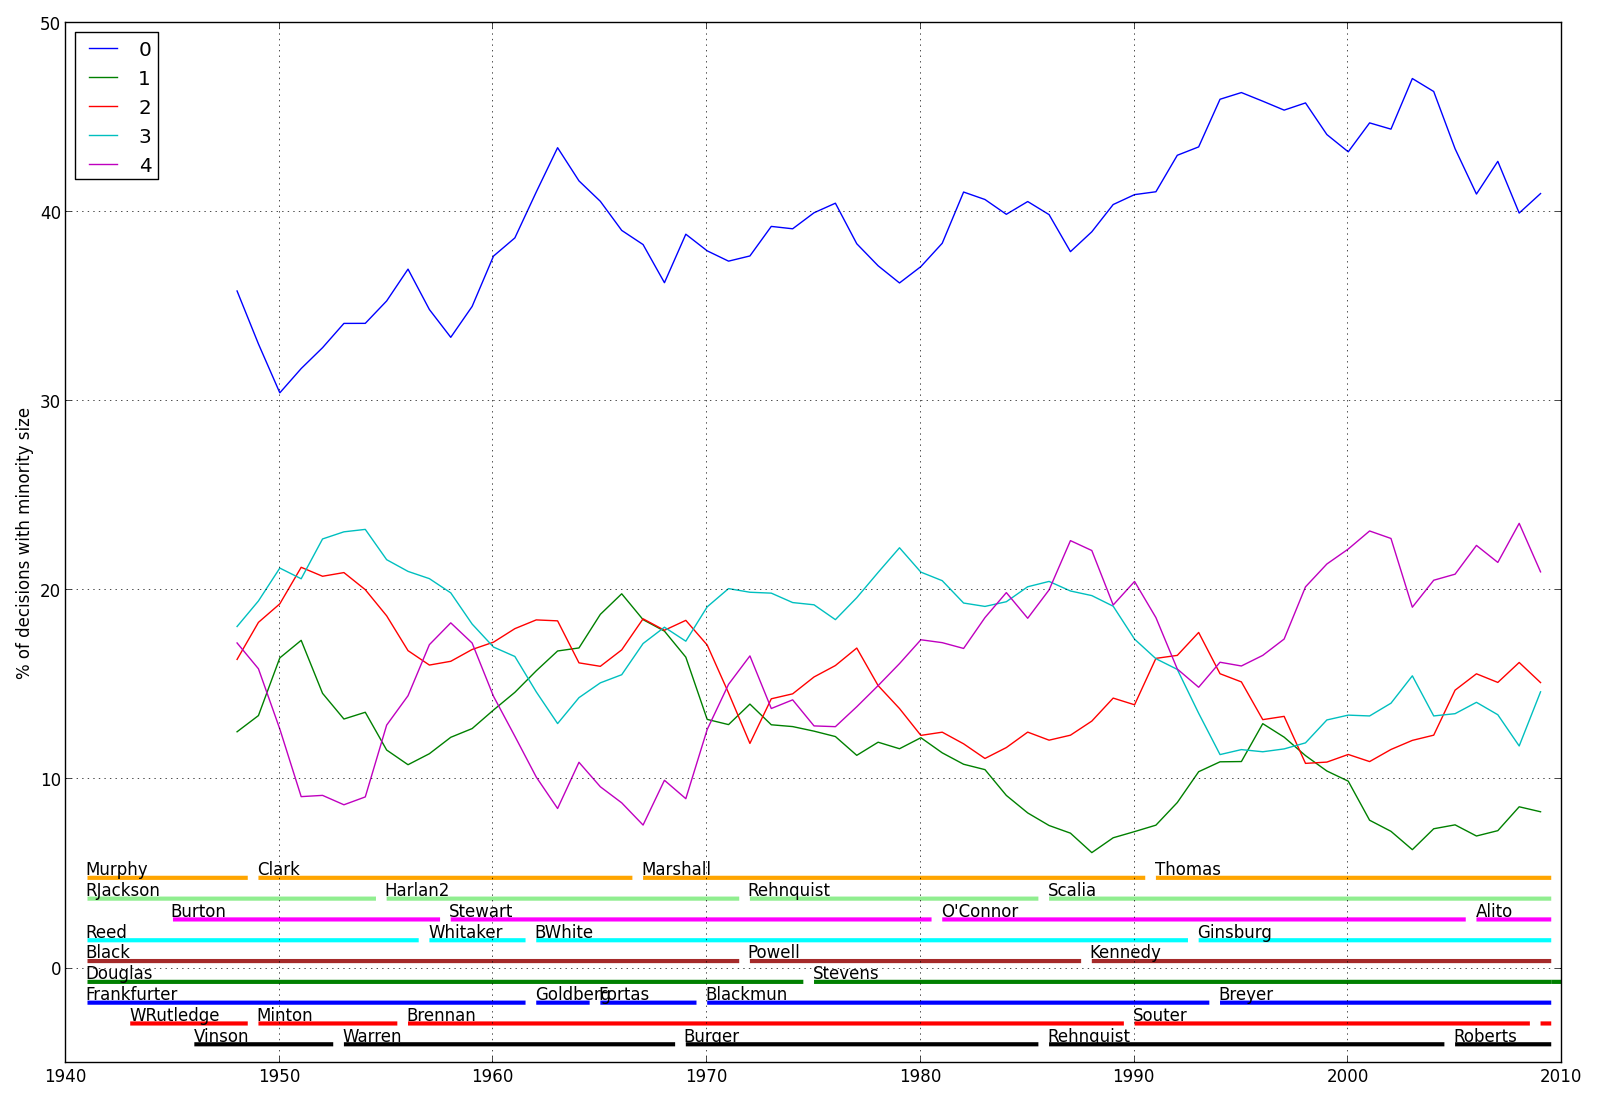
Anything surprise you? I’d bet a good number of people who look at this didn’t realize how common unanimous decisions are. I had a hunch they were more common than people thought, but even so I was surprised at their prevalence. Even in the supposedly-polarized recent past, over 40% of decisions are unanimous. Although there’s been a slight downtick in the last 10 years or so, the overall trend is clearly upward; unanimous decisions are more common now than they were during almost all of the post-WWII period covered by the data.
In fact, unanimous decisions are probably slightly underrepresented here, because, as I mentioned a while ago, I only considered cases where the individual votes of the justices were available. This excludes per curiam (“by the court”) decisions, which are unsigned decisions, typically without written opinions. Such decisions are generally assumed to have been unanimous (although there are unusual cases with dissents from per curiam decisions, notably Bush v. Gore. The (relatively small) number of per curiam decisions is not included in the total of unanimous decisions in the graph.
And what about 5-4 decisions? Are they more common than they used to be? It would seem the answer is yes over the medium term and the long term, but only sort of yes over the medium term. There are definitely more than there were 20 years ago, but that seems to be largely because at around that time (the mid-1990s) there was a notable decrease in 5-4 decisions. Since then, the level of 5-4 decisions has returned to where it was in the late 1980s. The overall trend, though is again positive: 5-4 decisions have generally been on the rise since the mid-1960s.
Still, though, there are nearly twice as many unanimous decisions as 5-4 decisions. Why are unanimous decisions not better known? One hypothesis is that they’re less exciting because they’re less contentious. It’s plausible that the public disgruntlement with 5-4 decisions is a self-fulfilling prophecy, and the relative obscurity of the much-more-common unanimous decisions is the flip side of that. Because the ideological leanings of the justices are fairly well known, politicians and the media often seem to have a fairly good idea of when a decision will be close. Since close decisions are more dramatic, this generates more press about the case, raising awareness and anticipation, which increases the impact when the decision is revealed.
Perhaps even more important, in any contested decision, there will be dissenting opinions as well as the majority opinion. These provide fodder for the media to engage in a more detailed postmortem, analyzing both sides. In an unanimous opinion, there is only one side of the story, which makes for a less interesting narrative.
There is also the possibility that uanimous decisions are inherently more boring. This would make a lot of sense, but it’s harder to assess without actually looking at the content of each case. It seems quite plausible that unanimous decisions might often result from “obvious” cases where one side is clearly a longshot. These would generate little attention for the same reason that third-party candidates generate little attention in elections: the game isn’t that exciting if there’s little doubt about who will win. (On the other hand, the Supreme Court has to have some level of interest to agree to hear the case in the first place.) One possible way to assess this would be to look at how the minority size correlates with whether the court affirmed or overturned a lower court decision; one could argue that affirmations are more “obvious” in the above sense. The dataset provides information on whether the result was an affirmation or not, but I haven’t analyzed that yet.
It would also be interesting to know whether decisions that have a larger or more concrete impact on people’s lives are more likely to be close. Cases that come before SCOTUS range from, on the one hand, relatively obscure issues dealing with unusual situations, to, on the other hand, basic law relevant to millions of people. Take the healthcare mandate decision for instance: regardless of what you wanted the result to be, it was fairly clear long before the decision that it would, one way or another, affect essentially everyone in the US. Compare that to Salazar v. Ramah Navajo Chapter, which found (according to Wikipedia) that “the United States government, when it enters into a contract with a Native American (Indian) tribe for services, must pay contracts in full so long as funds are available, regardless of whether sufficient funds are available to pay all such contracts.” This case was in litigation for over 20 years, and deals with an issue of national scope (US government dealings with Native American governments), but it’s safe to say that the decision will probably have little direct effect on most residents of the US.
Unfortunately, “importance” of a case seems tough to assess. The dataset does include information about the general area of law that the case applies to (e.g., First Amendment, separation of powers), but even within a certain legal area cases can vary in scope.
There are, of course, significant cases that are decided unanimously, or nearly so. Two recent cases having to do with gene patents, Bowman v. Monsanto and Association for Molecular Pathology v. Myriad Genetics, attracted a good bit of speculation and buzz, but in the end both decisions were unanimous. The closely-watched affirmative-action case Fisher v. UT Austin was a 7-1 decision.
So if unanimous and 5-4 decisions are both increasing overall since WWII, what’s decreasing? Something’s gotta give. As the graph shows, that something appears to be most “middling” decisions, those that are neither unanimous nor very close. Minorities of 1 or 3 justices, in particular, seem to be down markedly, with 3-justice minorities down since the late 1980s and 1-justice minorities down since the mid-1960s (with a short resurgence during the 1990s). So it seems that saying the court is polarized is not entirely accurate. Oddly, it seems that these days, the two most likely outcomes are that the Supreme Court is in full agreement, or narrowly divided. Middling levels of disagreement are less common.
Variation in the minority
Not just how many, but who
Of course, looking at the size of the minority only tells part of the story. One of the things that makes people call the court polarized is not just that there are 5-4 decisions, but that it’s always the same 5 against the same 4 — or perhaps the same 4 against the same 4, with Kennedy as the “swing vote”.
To assess this, we need to look at not just how many justices are in the minority, but how common each individual minority coalition is. I’ve seen some articles about this in the press. But these, including this recent one from the New York Times, tend to focus on the level of pairwise agreement between individual justices. This is an okay measure, but it makes it difficult to get a picture of the overall level of agreement between coalitions of justices. That is, knowing how often A votes with B and how often B votes with C and how often C votes with D doesn’t necessarily make it clear how often A, B, C, and D all vote the same way together.
So what I did this is to look at the information entropy of the distribution of minority coalitions. The entropy measures how lopsided the distribution is. If a small number of different groups of justices consistently band together in the minority, the entropy will be low. If there are many different groups of justices that join to form a minority, the entropy will be high.
In order to flip the direction of this measure, I simply took its negative (and added a constant to it to get positive values for convenience of plotting). This is the “negentropy” or negative entropy. The way to think about negentropy is as predictability. If the court is truly polarized, it should mean that you can fairly accurately predict exactly which justices will be in the minority — high predictability is high negentropy. If allegiances and alliances on the court are more fluid, you won’t be able to make such a prediction — low predictability is low negentropy.
What I’m looking at here is the negentropy of the minority in each vote, which I’m going to refer to as the “polarization score”. ((The negentropy of the majority should work equally well.)) To give timely examples, the most common result with the current court membership is that justices Breyer, Ginsburg, Kagan, and Sotomayor are in the minority. If this happened all the time, the polarization score would be very high — you could always predict what the minority vote was. But we all know that Kennedy sometimes switches, right? Well, you’d still get a pretty high polarization score if the only two possible results were either Breyer-Ginsburg-Kagan-Sotomayor in the minority, or Alito-Roberts-Scalia-Thomas in the minority. You’d get a very low polarization score if you had a very diverse panoply of justices banding together to vote together in the minority — e.g., if the outcomes above were no more likely than Roberts, Thomas, Breyer, and Sotomayor voting together.
Also a technical note: I actually computed the negentropy of all minorities except the “empty” minority that results in a unanimous decision. This means that the polarization score reflects the predictability of the minority given that the decision was not unanimous.
Caveats
Before discussing the results, I have to add a couple caveats, both having to do with the issue of changes in court membership.
The first is that the negentropy is to some extent influenced by the number of justices on the court during a certain period. Since we’re looking at the distribution of distinct minority coalitions, there will be obviously be more during a period when there is a change in court membership. For instance, if we look at the period around the time when Sotomayor replaced Souter, we actually have 10 different justices who could be in the minority. This will tend to decrease the polarization score. I played around with different ways of normalizing the polarization against the number of justices on the court during a given timespan, but none of them seemed to work out. More importantly, I think the effect is relatively minor, because the amount of turnover on the court is overall relatively low. The most different justices that were ever on the court during a 5-year period in the dataset was 13, and the least was, of course, 9 (during periods when there was no change in membership), which isn’t too big a spread.
The second caveat is potentially more serious. As discussed above, when one justice replaces another, the number of distinct minority coalitions is likely to increase. The problem is that in many cases, this increase is illusory, because from an ideological perspective the earlier justice and his or her replacement are “interchangeable” in terms of voting patterns. This isn’t always the case, but when it is, it can misleadingly lower the polarization score.
For instance, before Souter retired, there were a lot of cases in which he voted in the minority along with Breyer, Ginsburg, and Stevens. After Souter retired, he was replaced by Sotormayor, whereupon we began to see a lot of cases in which Sotomayor voted in the minority along with Breyer, Ginsburg, and Stevens. These are counted as two separate minorities, which lowers the polarization score, but many observers would consider both outcomes “the same” in that they are both cases of “four liberal justices are in the minority against five conservative justices”.
Unfortunately, there’s no obvious way to get around this except manually lumping justices together into “mega-justices” — sequences of individual justices with similar ideological leanings. I was too lazy to do this. But aside from that, it’s not clear that it could be done in a totally defensible way. There are some edge cases where it would be hard to say whether a certain justice was “similar enough” to his replacement to be counted as the same. Also, the ideological leanings of some justices change noticeably during their tenure (e.g., John Paul Stevens).
The results
The figure below shows the polarization of the court from 1946 through 2011. This is again calculated over a 5-year moving window.
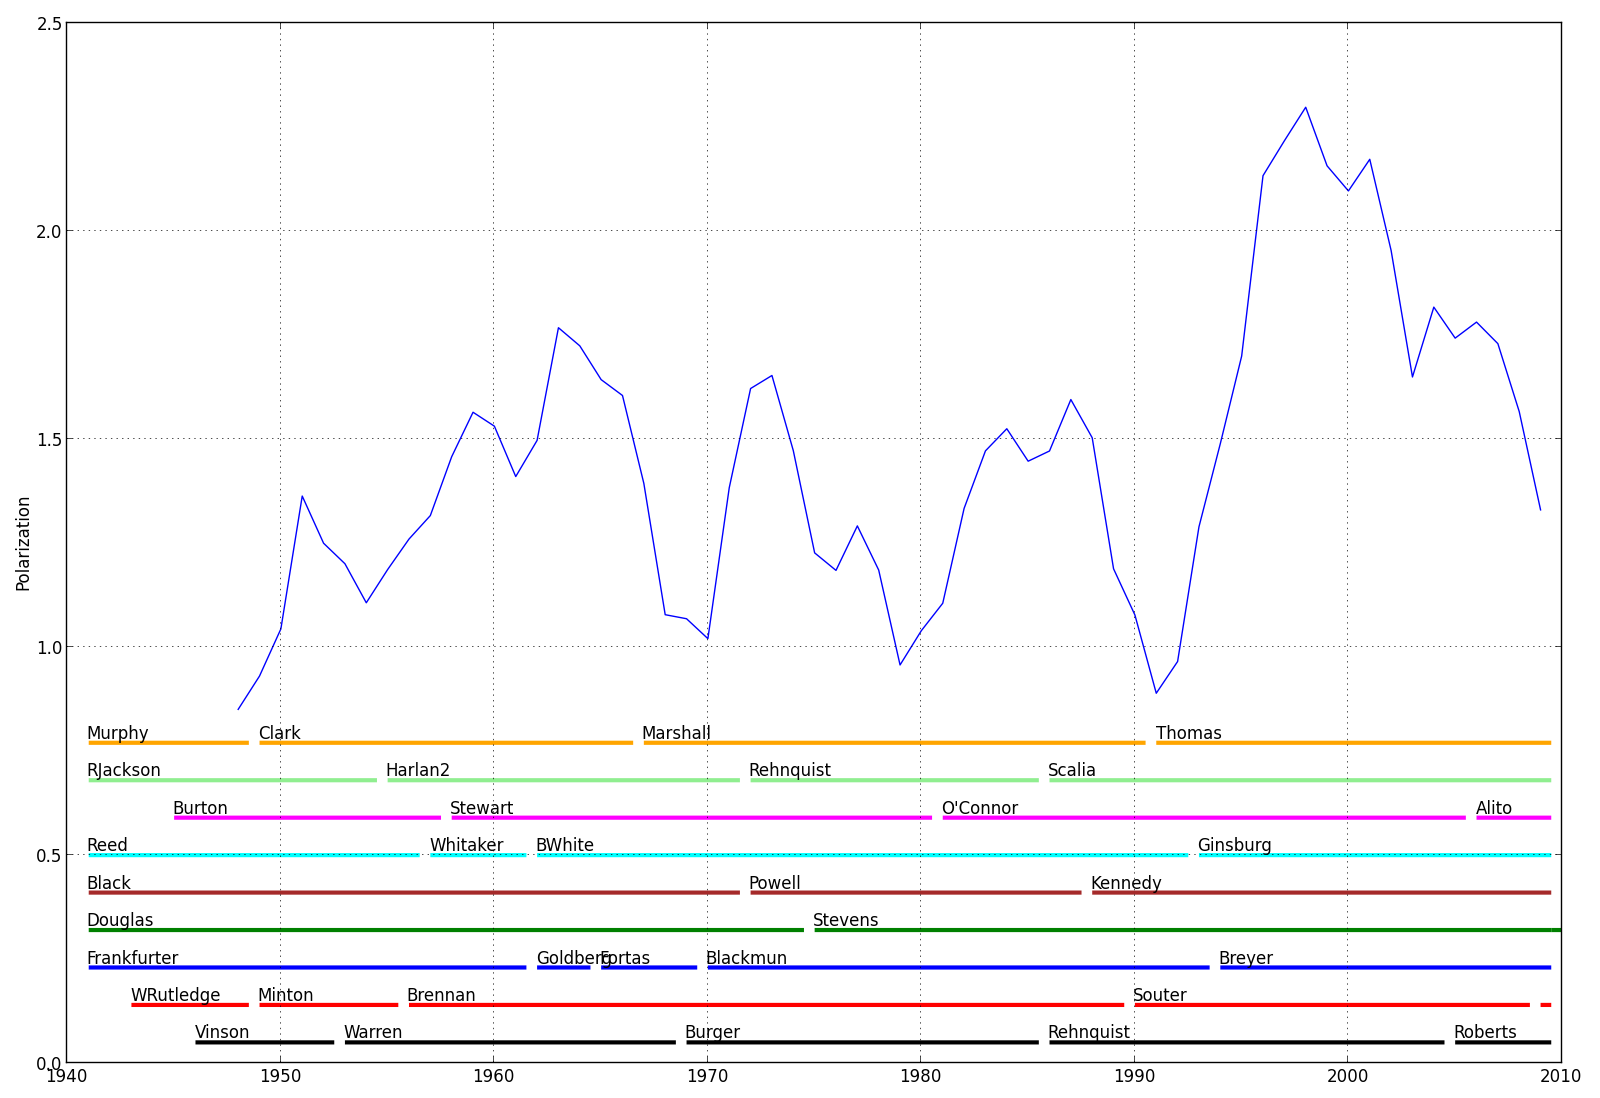
This graph definitely makes it seem as though the court is very polarized relative to its historical level. The polarization score shot up in the late 1990s. More recently, in the period roughly corresponding to Roberts court, there has been a slight drop. However, as noted above, the replacement of one justice by an ideologically similar one may artificially deflate the score. The last three justices to be replaced have been fairly similar to their predecessors (Roberts replaced Rehnquist, Sotomayor replaced Souter, and Kagan replaced Stevens), meaning that this drop may be illusory. Even so, this period (except for the very tail end) is about the highest polariziation-wise since WWII.
This entropy measure, then, supports the notion that the court really is more polarized these days than it was in past decades.
Pop quiz
Even so, here’s a little pop quiz. Four of the most closely watched cases in recent years were the healthcare mandate case NFIB v. Sebelius, the affirmative-action case Fisher v. UT Austin, and the two gay-marriage cases (Hollingsworth v. Perry and US v. Windsor). How many of those cases were decided by a “normal” 5-4 majority? That is, which had Alito, Roberts, Scalia and Thomas on one side, and Breyer, Ginsburg, Kagan, and Sotomayor on the other? (I’ll count Kennedy as OK on either side.) For bonus points, say not just how many cases but which case(s) were decided along standard battle lines.
Answer: One. I already gave you one piece of the answer earlier: Fisher v. UT Austin was a 7-1 “landslide”. NFIB v. Sibelius had Roberts joining the four liberal justices in the central decision (although various combinations of justices joined in other parts of the decision). Hollingsworth v. Perry, the case dealing with California’s Proposition 8 was a 5-4 decision, but the votes were unusual: Roberts and Scalia, together with Breyer, Ginsburg, and Kagan, were in the majority, leaving Alito, Kennedy, Sotomayor and Thomas in the minority. The only one of the four cases that was a “party line” decision was US v. Windsor (the DOMA case).
The Hollingsworth v. Perry case, in particular, seems to surprise some people. Some people I’ve talked to assumed that both of the gay-marriage cases were party-line 5-4 votes, but only one was. In any case, my point is that even this historically polarized court can surprise us in a big way now and then.
Judge for yourself
To have a little fun, I decided to make a visualization of the voting behavior of the justices. To do this, I used the pairwise agreements between the justices. However, instead of just displaying them individually, I used D3 to a make a force diagram.
Basically what this does is it tries to put justices closer together the more they vote in agreement. Justices that vote together a lot will be closer than justices that disagree a lot. There is inevitable distortion from trying to make all these distances fit onto a flat diagram, so the diagram isn’t perfect, but it’s fun anyway.
You can drag the sliders at the bottom to change the time range. By dragging the two ends of the upper slider, you can change how many years are shown, and by dragging the bottom slider you can shift this range forward or back in time. Whatever time range you pick, all justices who were on the court at any time during that period will be shown on the plot, and their relative distances will reflect their tendency to vote together during that period. (Justices who never sat on the court together can move freely with respect to each other.)
The distortion on the graph will be larger the more justices it shows, since it will try to pack more and more spatial constraints into a two-dimensional display. If you expand to the whole range, you’ll see all justices.
Whither SCOTUS?
The Supreme Court is an interesting voting body to analyze. Compared to something like Congress, it’s membership is tiny and changes very infrequently. This means that the voting behavior of individual members can have a significant impact on the overall action of the court. This sort of individual voting power is rare in legislative bodies.
These results do lend support to the idea that polarization and 5-4 decisions are on the rise, but unanimous decisions also have seen a steady increase over the last 65 years.