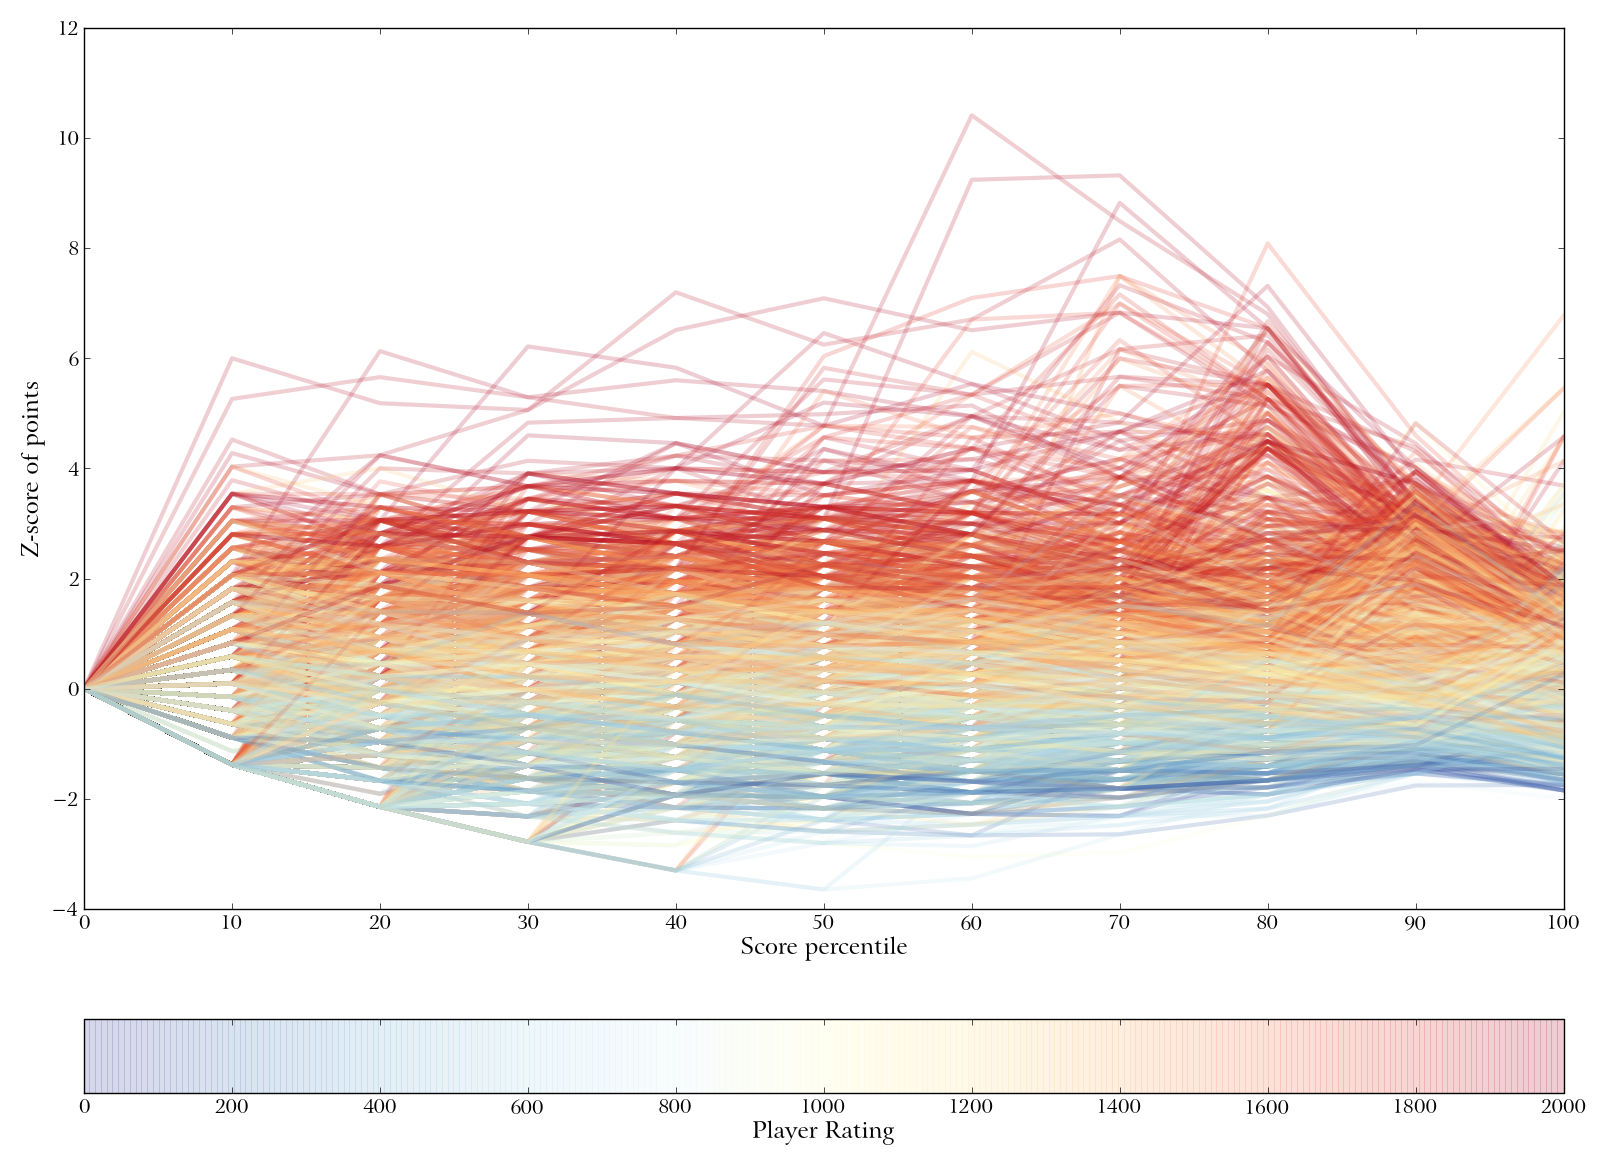
Z-scores of plays at various percentiles. Each line represents one player, with the color of the line representing the player’s rank. X-axis represents percentile (e.g., “40” means the score at each player’s 40th percentile). Y-axis is in z-scores normalized to the overall mean at each percentile. The large jump at 80th percentile, and smaller jump at 90th percentile, indicate that what differentiates good players is their ability to make more super-high-scoring plays (i.e., bingos).