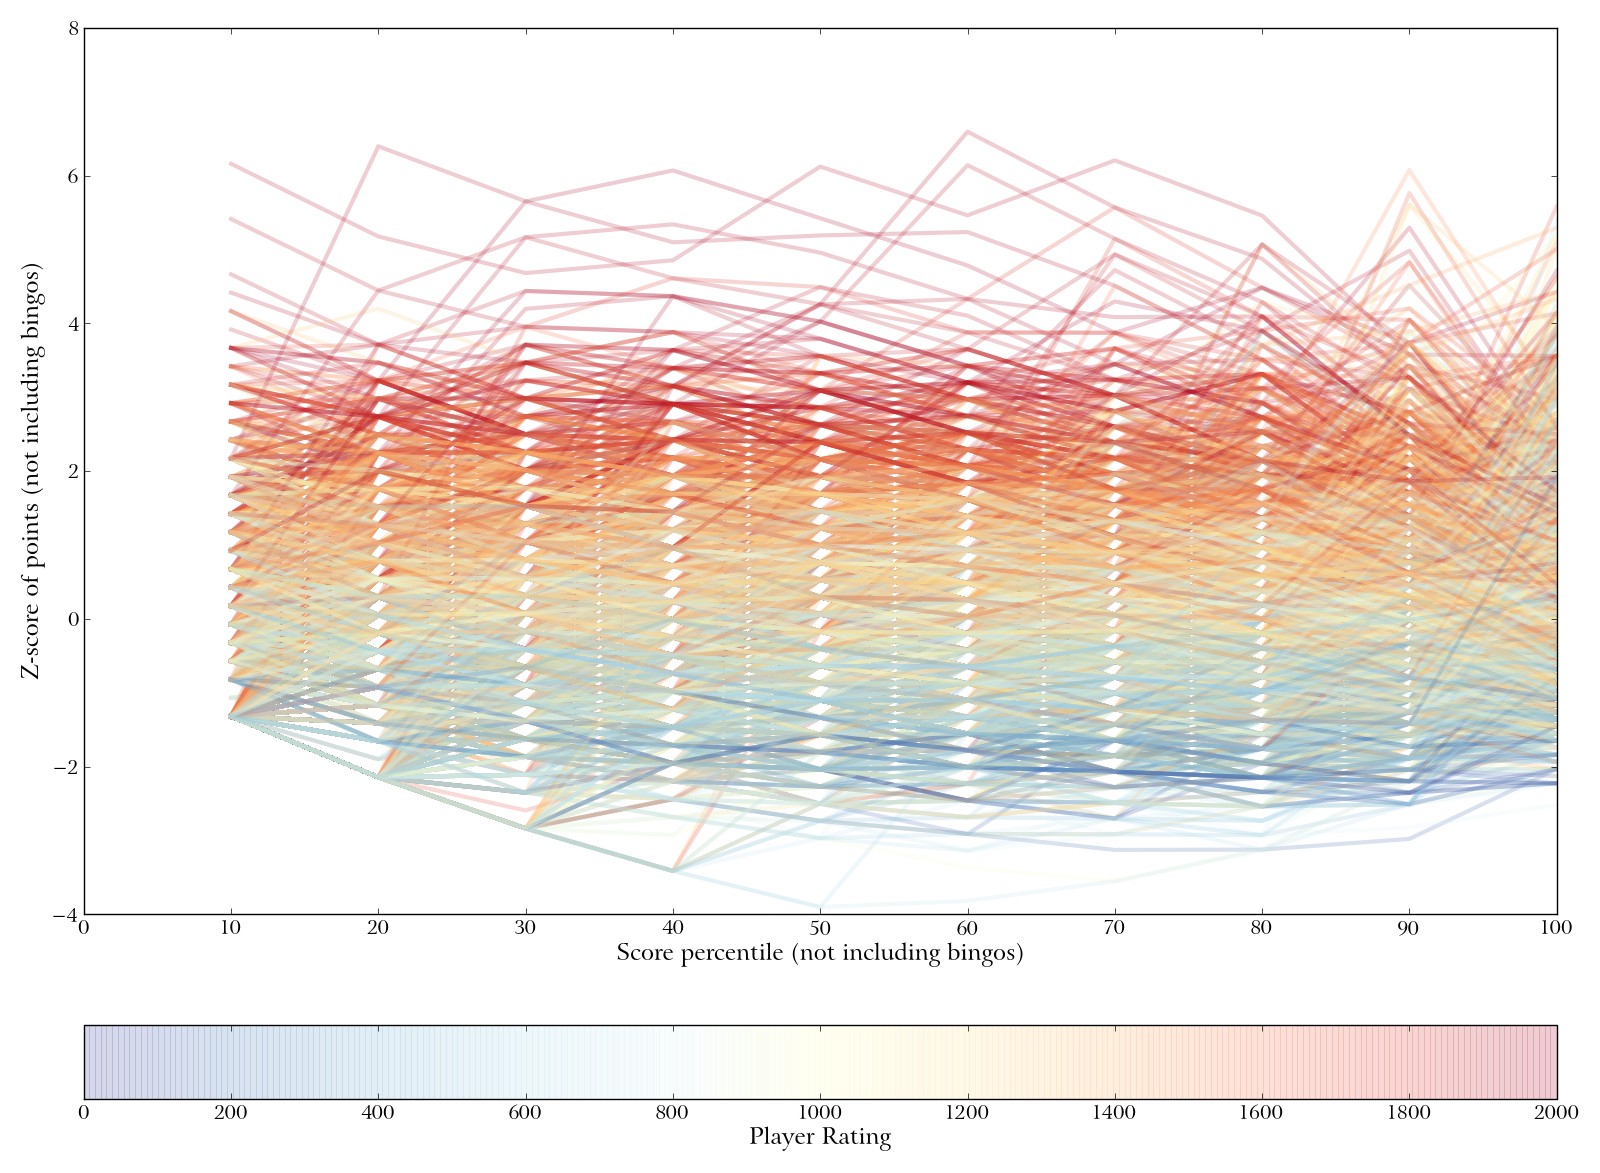
Z-scores of scores at 10 percentiles. Each line represents one player, and the color of each line represents that players rating. On the x-axis, e.g., “40” indicates a given players 40th-percentile score. Y axis is in z-scores (standard deviations from the overall mean Nth-percentile score). Separation among colors is greater at the lower percentiles, indicating that good players make better bad plays.