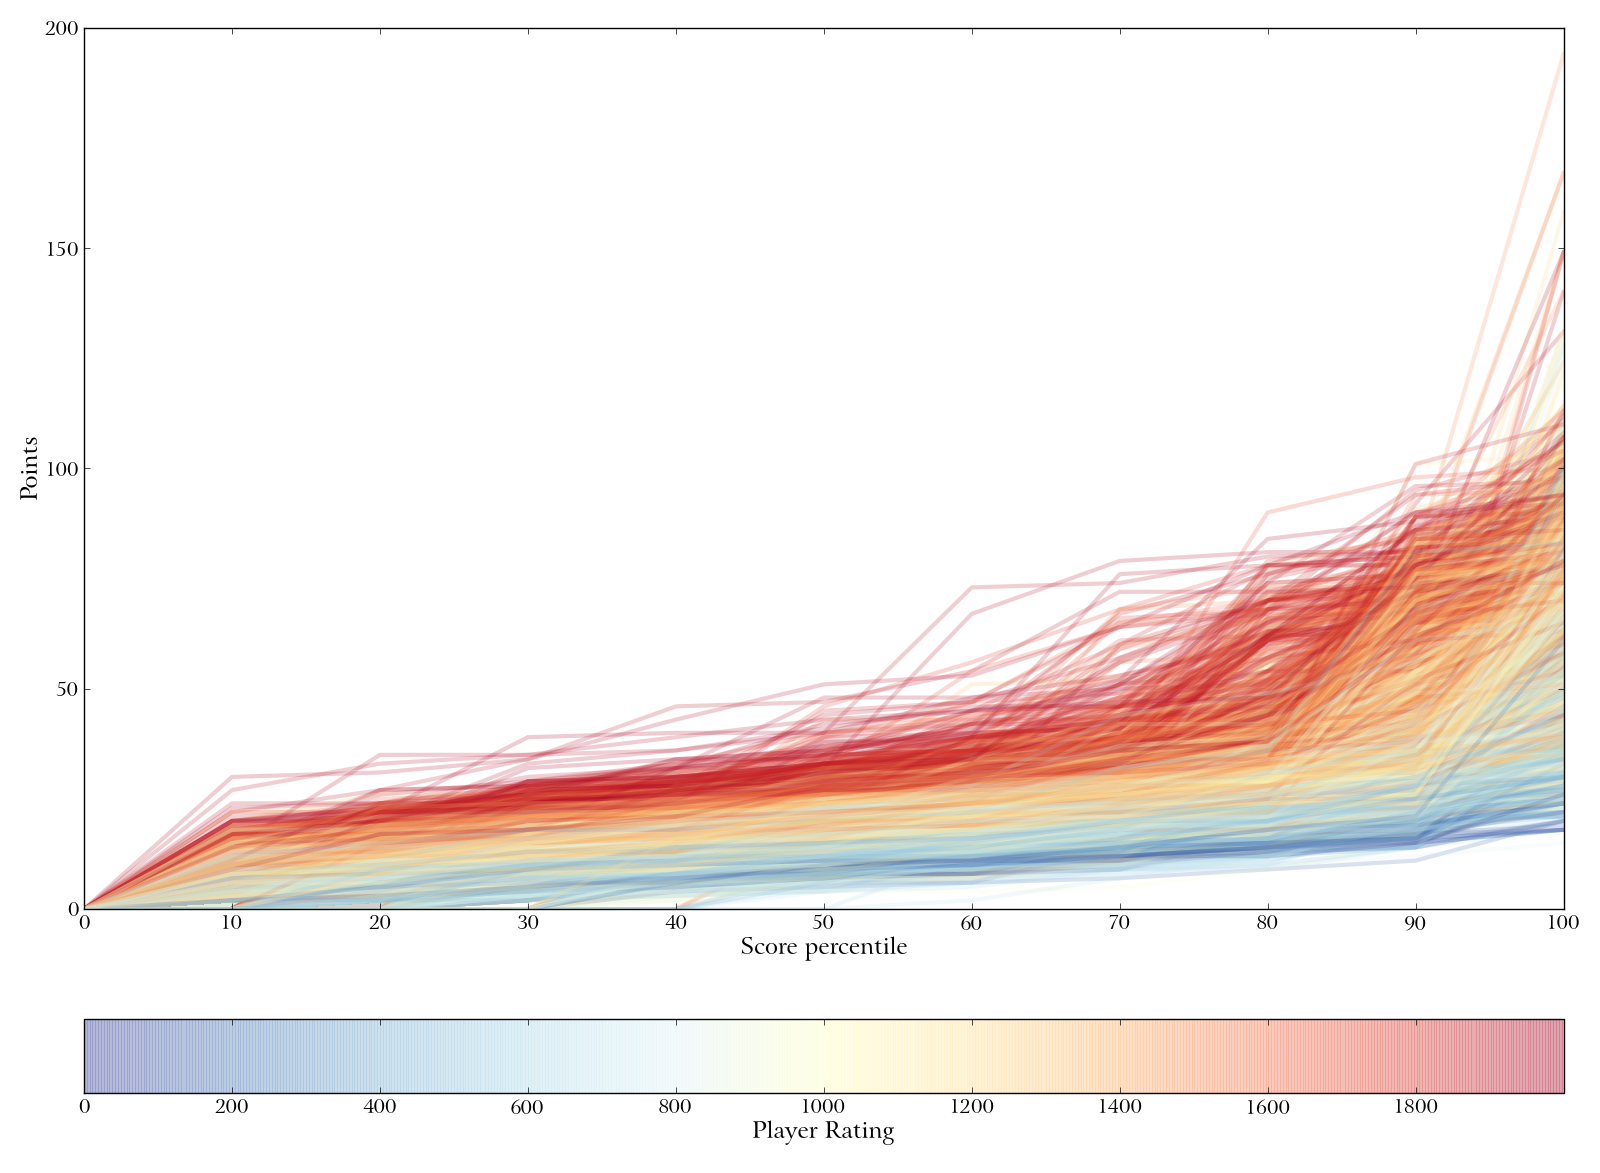
Score growth by percentile. Each line represents one player, with the color representing the player’s rank. Each line traces the growth of that players score from their worst plays (10th percentile) to their best (100th percentile). Note how the separation between colors decreases at the last few percentiles, indicating that, while many players can make one great play, the really good players can make multiple great plays.