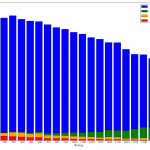
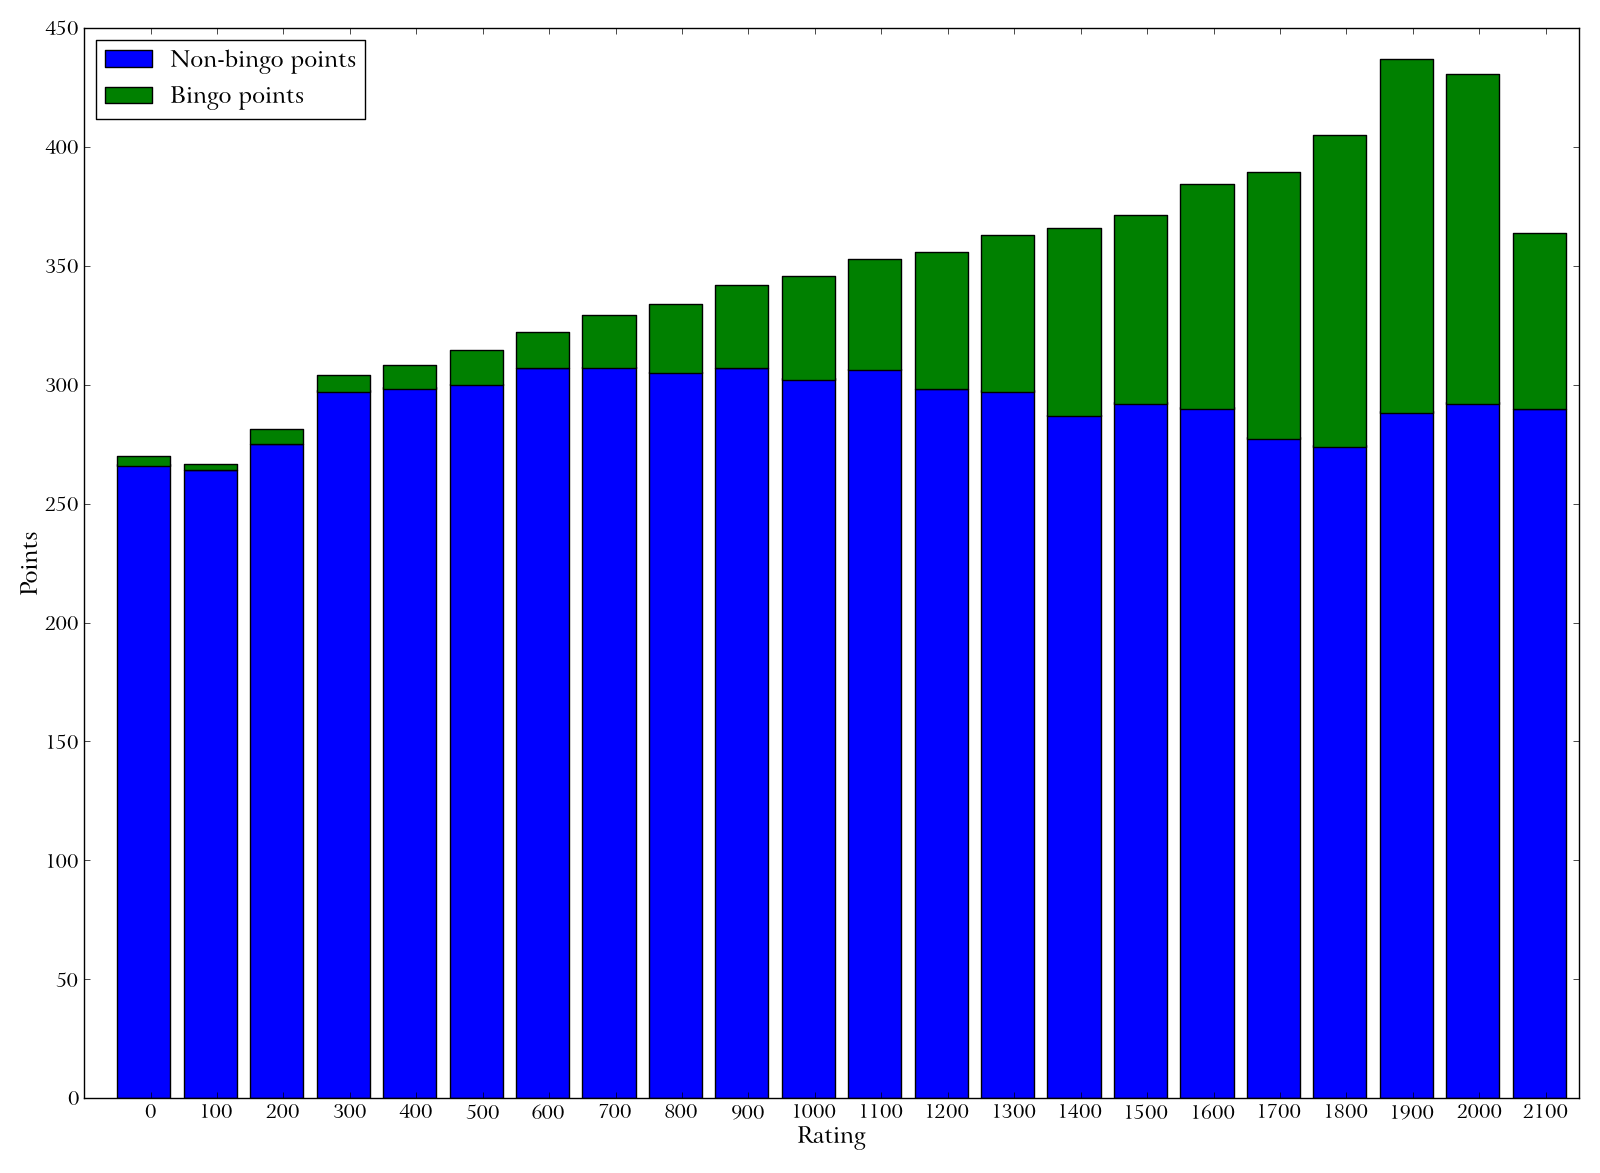
Bar graph of rating versus point distribution. Each bar represents players whose rank falls in a certain range (“0” is players whose rank is 0-100, “100” is players whose rank is 100-200, etc.). Blue bars represent the average non-bingo points per game among those players; green bars are the average bingo points per game. Virtually all of the increase in total points from low- to high-ranked players is due to an increase in bingo points.