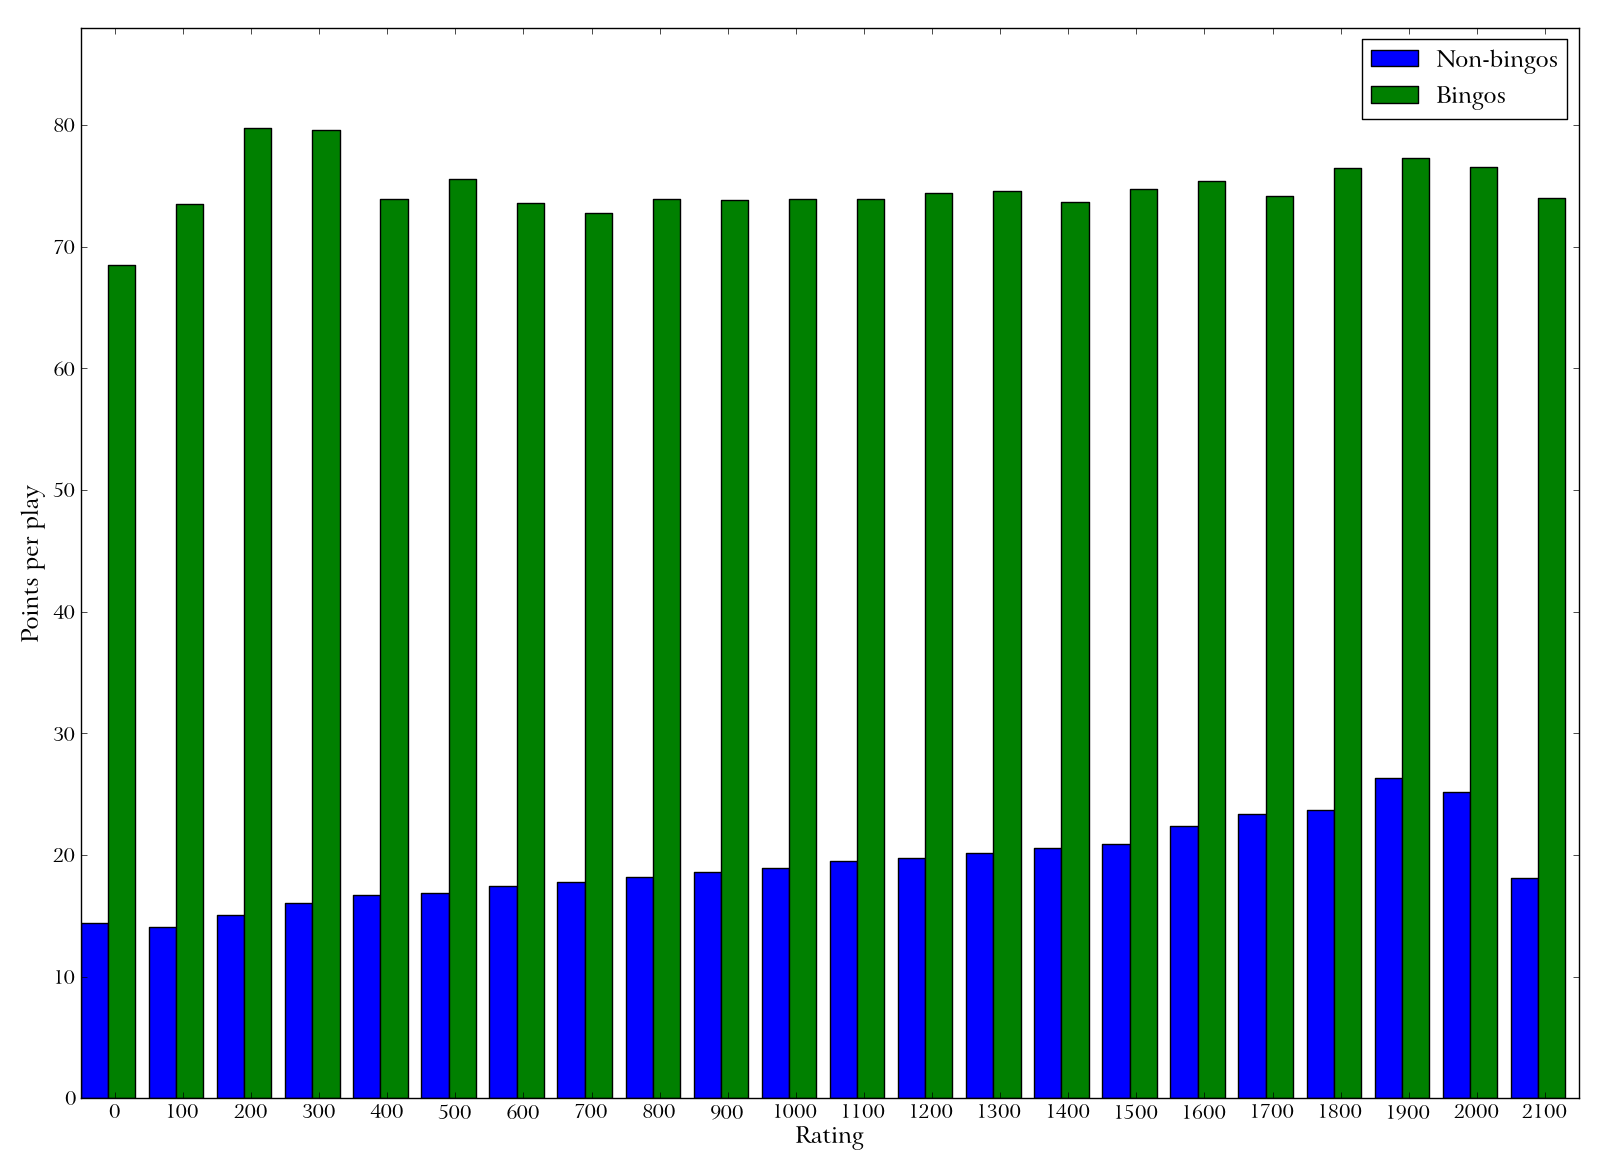
Bar graph of rating versus mean points per play. Each bar group represents players whose rank falls in a certain range. Green bars represent the average number of points per bingo, blue bars the average number of points per non-bingo play. Good players get no more points, on average, from an individual bingo than poor players, but they do get more points from a non-bingo.