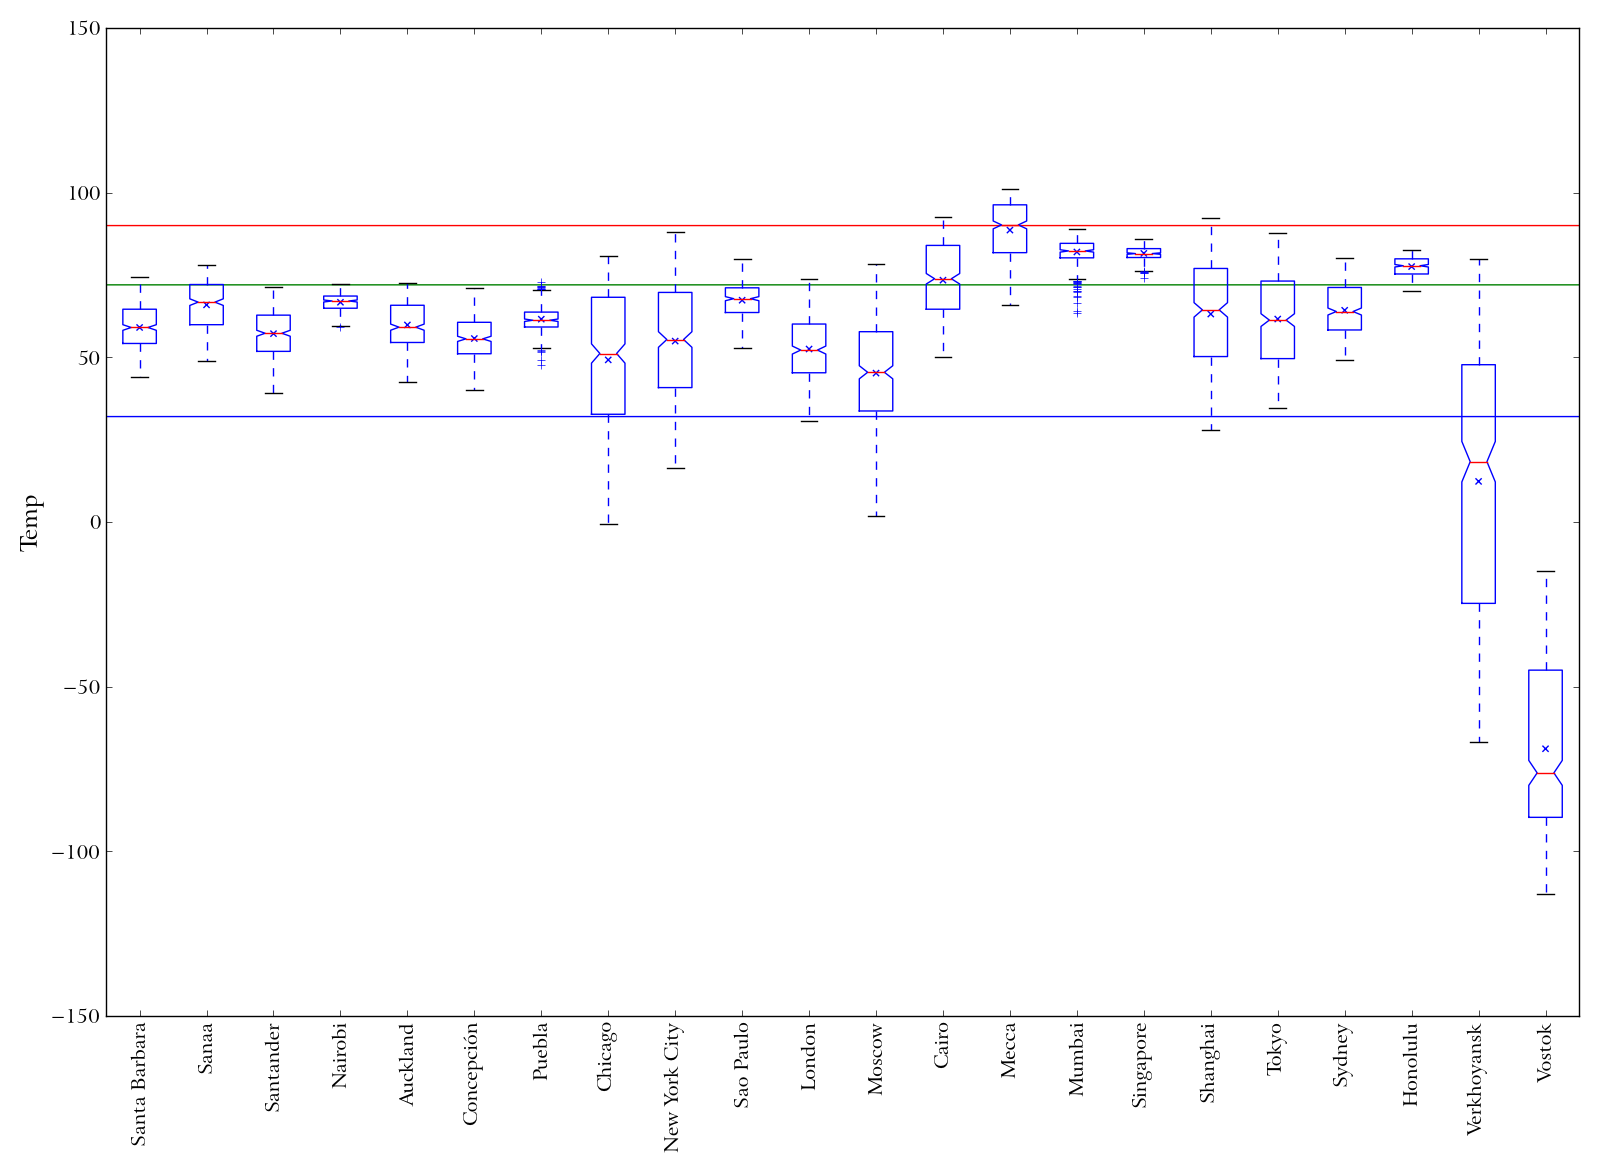
2008 daily average temperature distribution for each of 20 world cities, plus Verkhoyansk, Russia and Vostok Station, Antarctica. Blue line is at 32 F (too cold), red line at 90 F (too hot), green line at 72 F (just right).
Tags
Archives
- August 2013 (1)
- April 2013 (1)
- August 2012 (1)
- June 2012 (1)
- November 2011 (2)
- November 2010 (1)


