
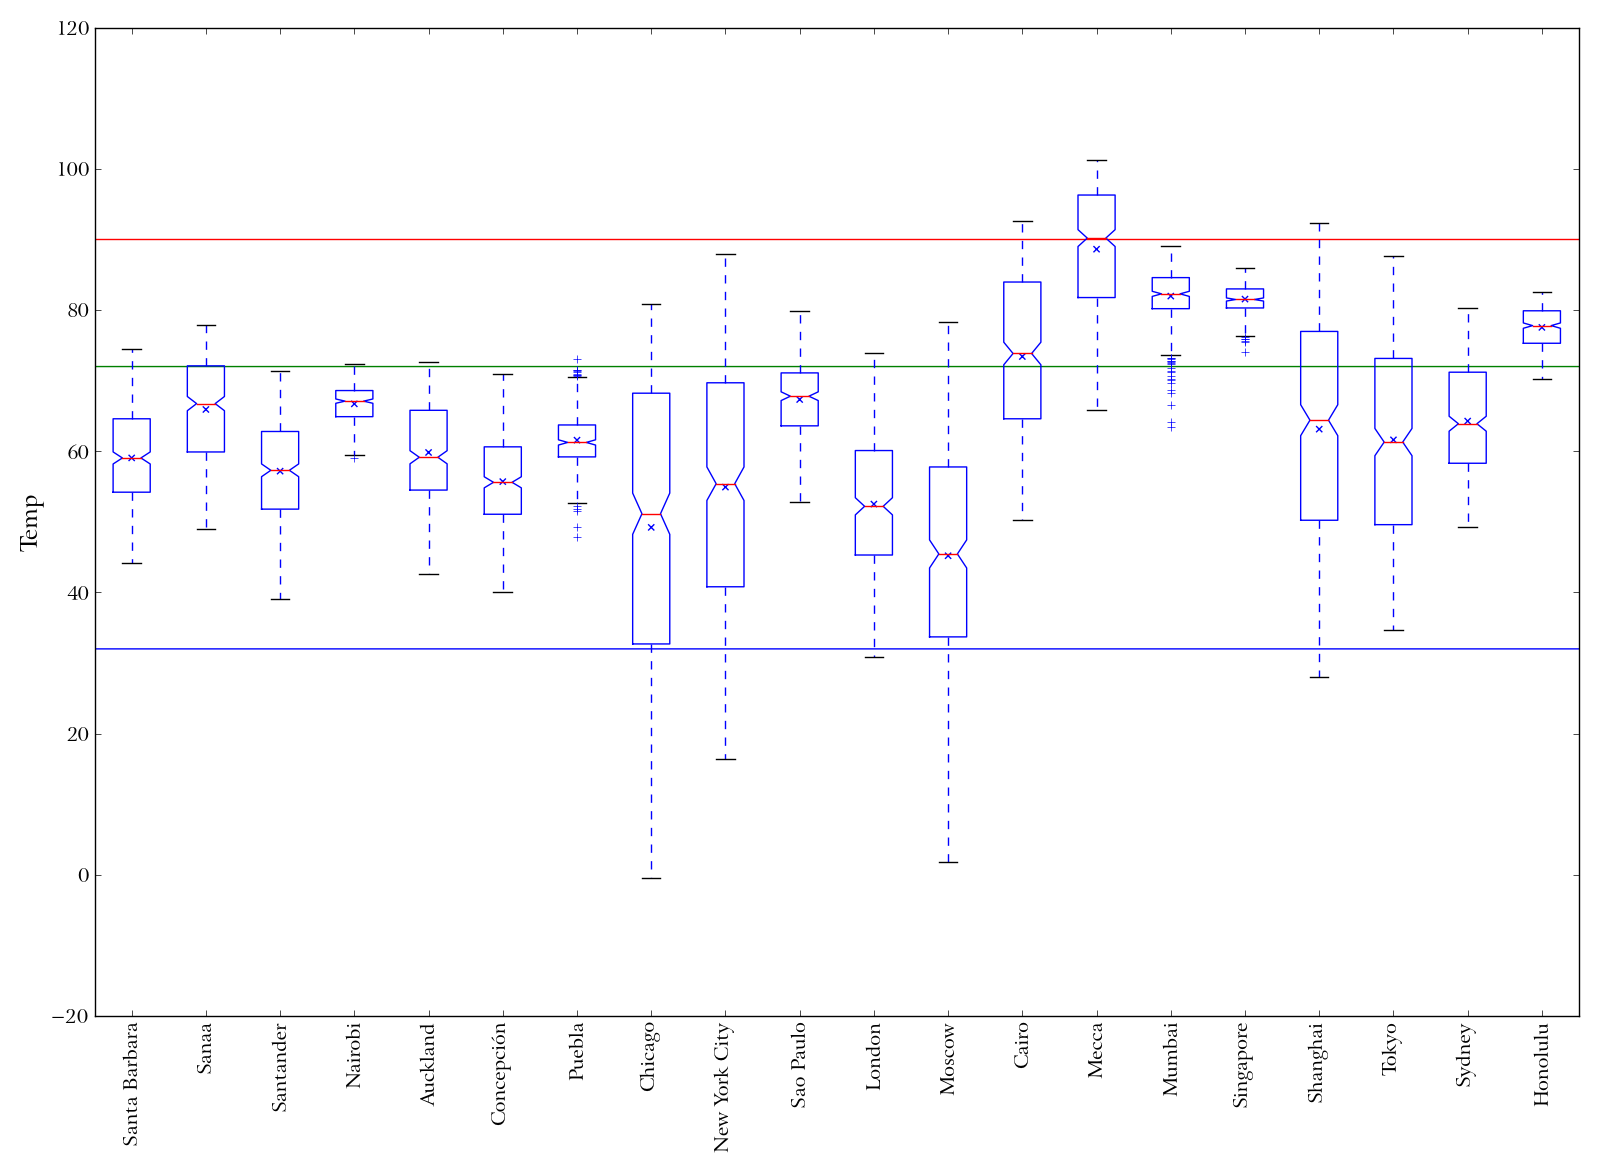
2008 daily average temperature distribution for each of 20 world cities. Blue line at 32 F (too cold), red line at 90 F (too hot), green line at 72 F (just right).
2008 daily average temperature distribution for each of 20 world cities. Blue line at 32 F (too cold), red line at 90 F (too hot), green line at 72 F (just right).