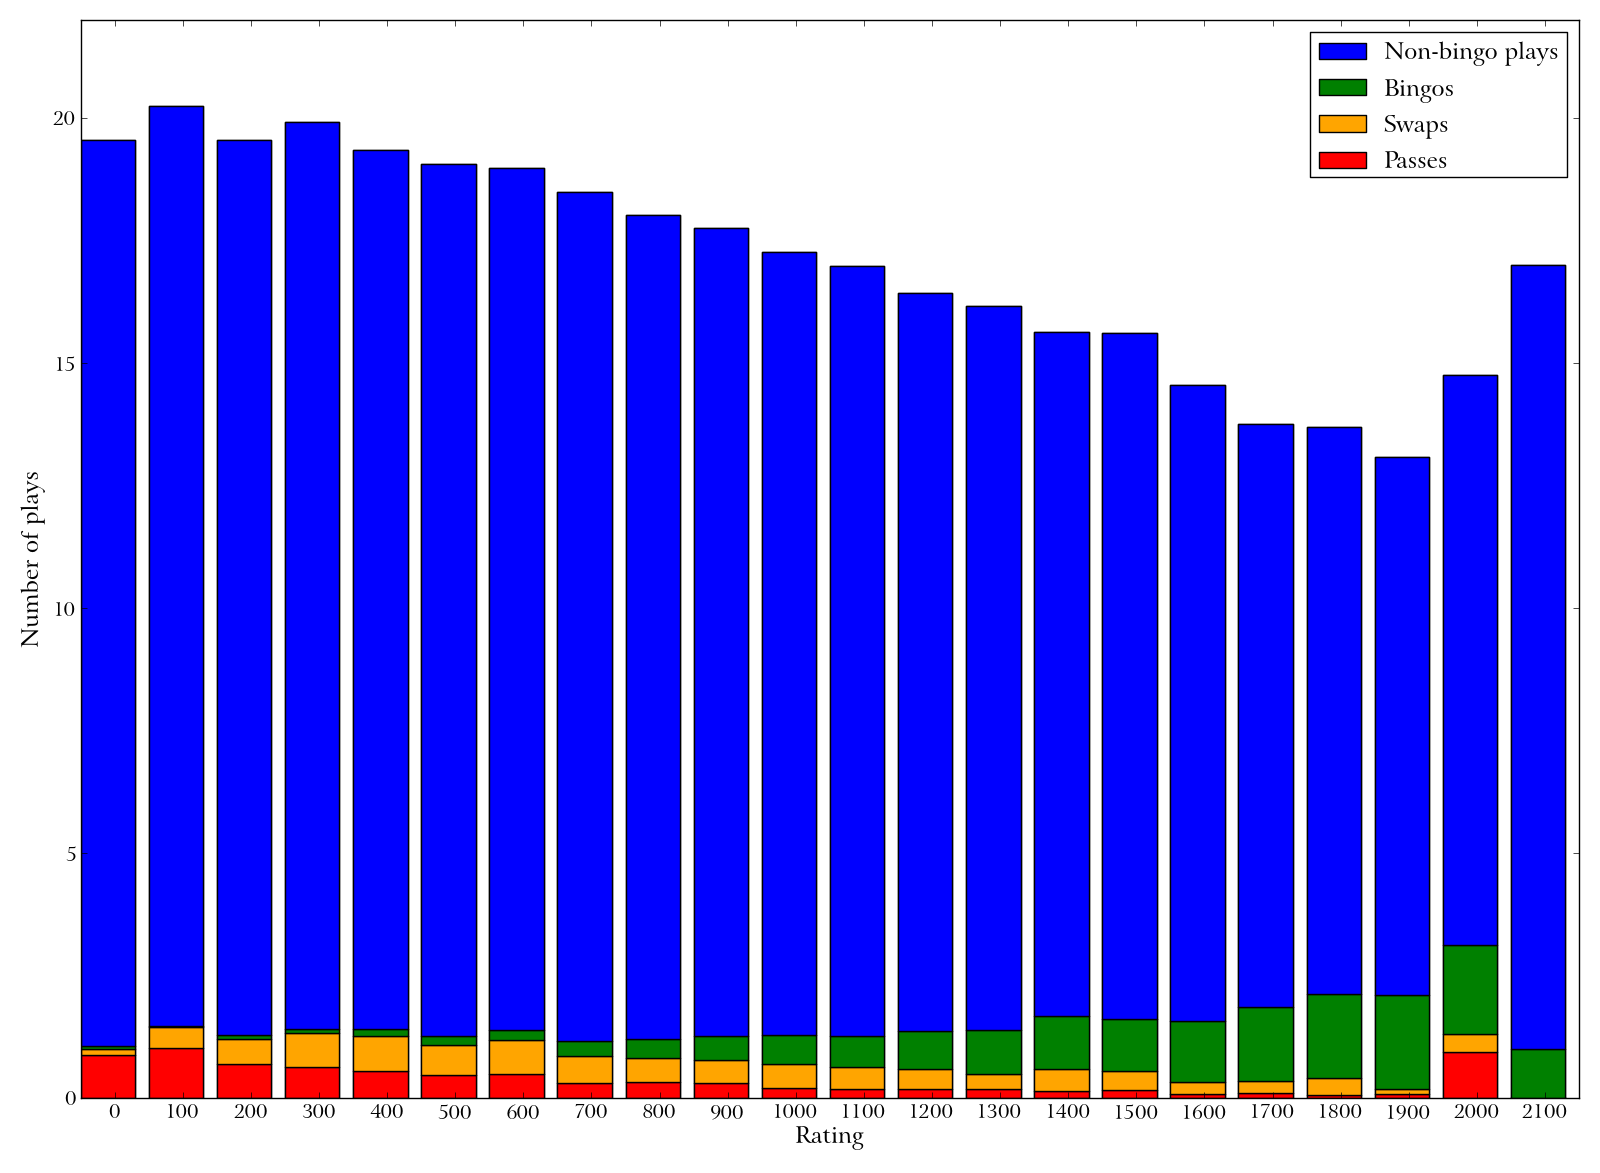
Bar graph of rating versus play distribution. Each bar stack represents players whose rank falls in a certain range. Blue bars show the number of non-bingo plays per game (e.g., the player laid down between 1 and 6 tiles). Green bars show the number of bingos per game. Orange is number of turns used in swapping tiles, and red is number of turns passed (without playing or swapping). Good players play more bingos, and hence fewer non-bingo plays.