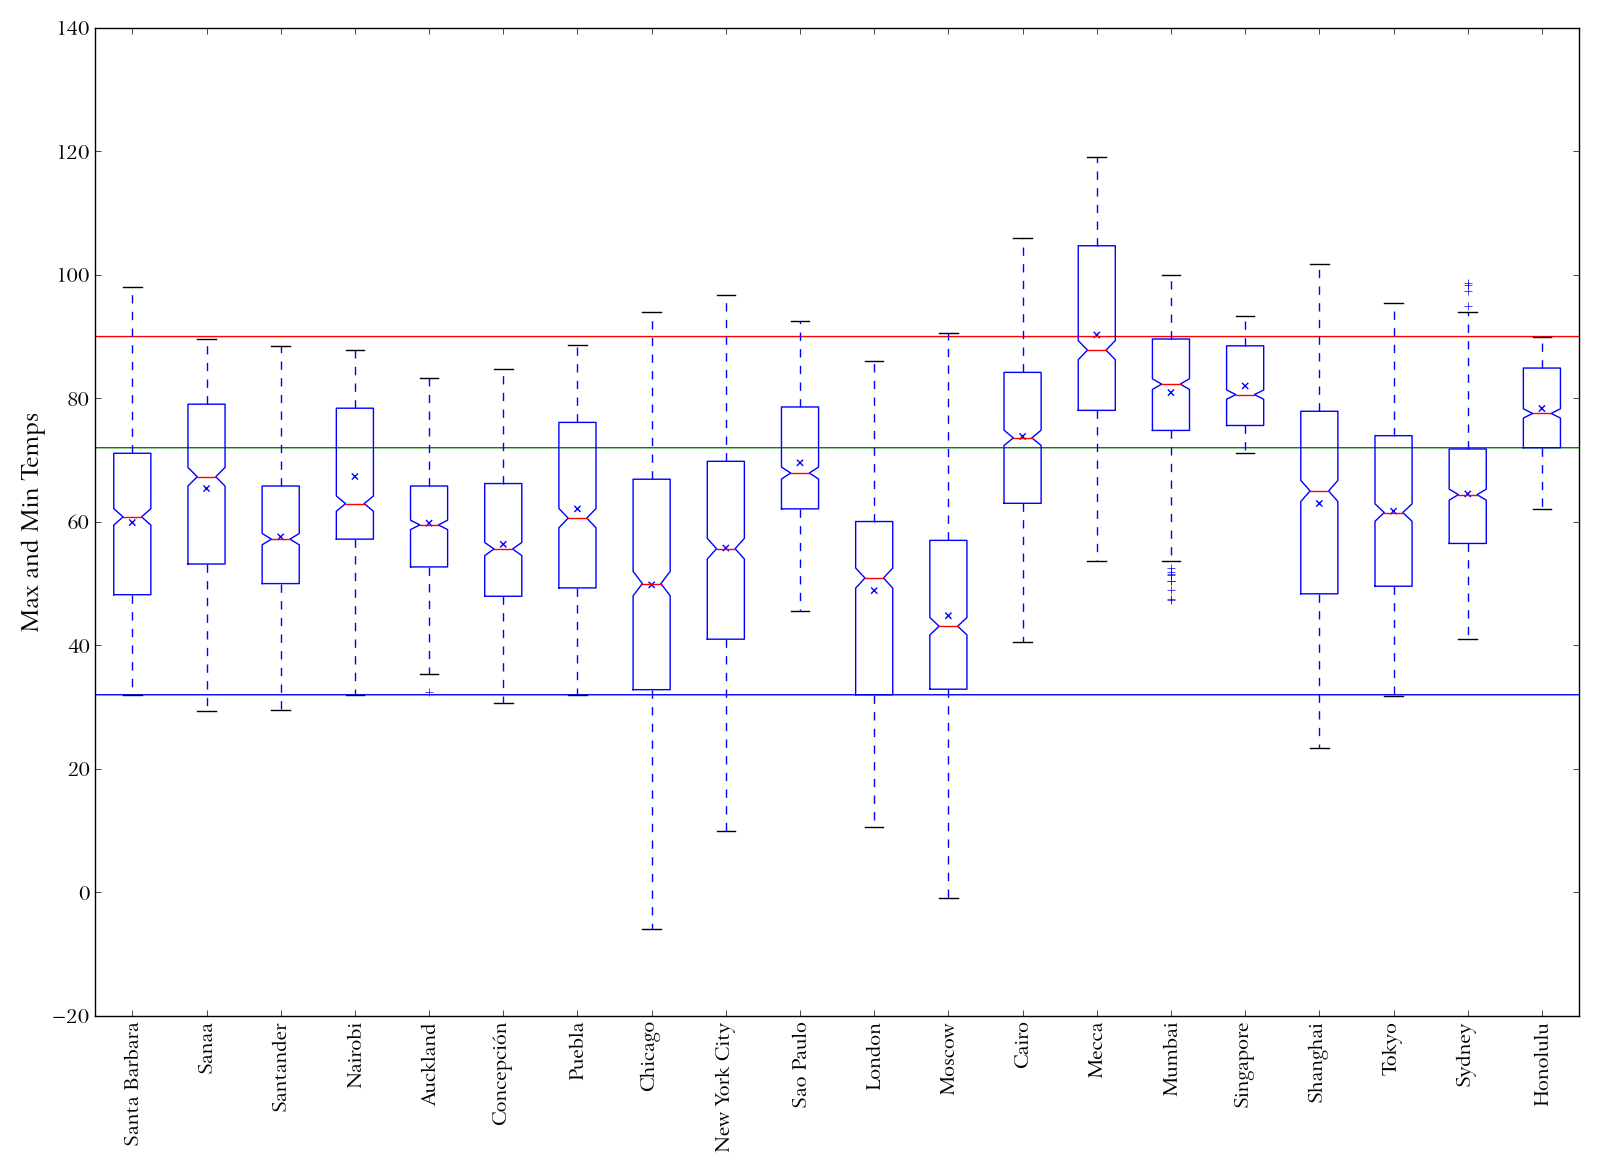
2008 distribution of maximum and minimum daily temperatures for each of 20 world cities.
Required fields are marked *