
I play a lot of Scrabble. In this day and age, it’s often a point of pride for people to say they’re not on Facebook. Well, I’m on Facebook, but most of my time on the site is spent playing other people with the Scrabble app.
I’ve gotten pretty good over the years, but I’m still pretty puny in comparison to the really good players. I often start random-matchup games with other Scrabble users who are total strangers to me, and every once in a while I’ll get matched with one of these heavyweights who just blows me away. More often, I get matched with a lightweight who I just blow away. Sometimes I get matched with a middleweight like me and we rematch each other endlessly.
Inevitably, of course, I found myself wondering: What is it that makes good Scrabble players good? Like, what do they do differently? Do they make more good plays, or fewer bad plays? Is it really true what everyone says about how learning all the 2-letter words is the key to victory? What is it that separates the wheat from the chaff, Scrabble-wise?
Well, that’s an. . . (drumroll) interesting question! And in typical Interesting Question fashion, I decided to try to analyze it by getting my hands on some data.
I’d wanted to analyze Scrabble data for a while, but I couldn’t find any good data set. There don’t seem to be any websites that offer large archives of Scrabble game records. I found one or two, but they seem to focus on archives of professional games, whereas I was particularly interested in the whole spectrum of skill levels, and how they’re differentiated.
So I had to creep up on my analysis by first getting some data. The Internet Scrabble Club is an online server that I had checked out briefly in the past. Unlike Facebook Scrabble and other apps of that sort, it’s not web-based. Instead, you download a special-purpose client program and connect to the server like you would to a MUD or an online RPG or whatever. The nice thing about this for my purposes was that it meant I could, at least potentially, figure out the protocol for this client/server setup, and use it to programmatically download lots of games.
The data
So that’s what I did. It took me a bit of fiddling around, but I managed to reverse-engineer the ISC protocol just enough to write a bot that would connect to the server, get a list of all active users, and download logs of their most recent games. These were all two-player games, which I think is all ISC lets you do.
One cool thing about ISC is that it has dictionaries for several languages: you can play games in English (using either of the two standard dictionaries, TWL or SOWPODS ((TWL is the standard dictionary used in North American Scrabble. SOWPODS is used in most other English-language Scrabble.))), French, Romanian, Italian, Dutch, or a crazy “multilingual” dictionary that includes words from multiple languages. I’m planning to analyze how the game differs between different languages in a later post.
Another useful thing is that, like many online Scrabble venues, ISC has a rating system that assigns a numerical rating to each player based on their win/loss record. The details of the rating system are a bit strange (you can read the explanation here), but I’m going to assume that the rating does its job in that people who play better on average get higher ratings. This is a good piece of information to have, because it gives a measure of how good a player “really is”, taking into account their historical record; this can then be compared with how they do in individual games and even individual plays.
For this post, though, I’m just focusing on the data with the two English dictionaries. After tossing out a small number of “degenerate” games (ones that were abandoned without being finished or the like), I wound up with 4625 games, roughly evenly split between TWL and SOWPODS. They included players ranging in rating from 0 to about 2000, plus a couple outliers at around 2300 and 2600 (who will be clearly visible in many of the upcoming graphs). The mean rating was about 1000, with a median of 964 and a standard deviation of 388.
The ratings were more or less evenly distributed around the mean and median, which is good, since it means the results won’t be thrown off by grossly disproportionate rating distributions. However, I should note that the way the data were obtained was limited by what ISC lets you do. All I could get from ISC was a list of the most recent 10 games by each player who was connected to the server at the time my bot grabbed the data ((It was actually less than 10 games in some cases, if the player was new and hadn’t played 10 games yet.)). Plus, some of those games were duplicates because any single recent game might show up in the lists of both opponents. I threw out the duplicates, but it’s still true that the dataset is skewed towards very recent games. Some players seem to be real maniacs and will play several games a day. (Not that I know anyone like that. Ahem.) This could make a difference if players who play a lot on the server are predictably different from Scrabble players in general. But I digress.
Bingo
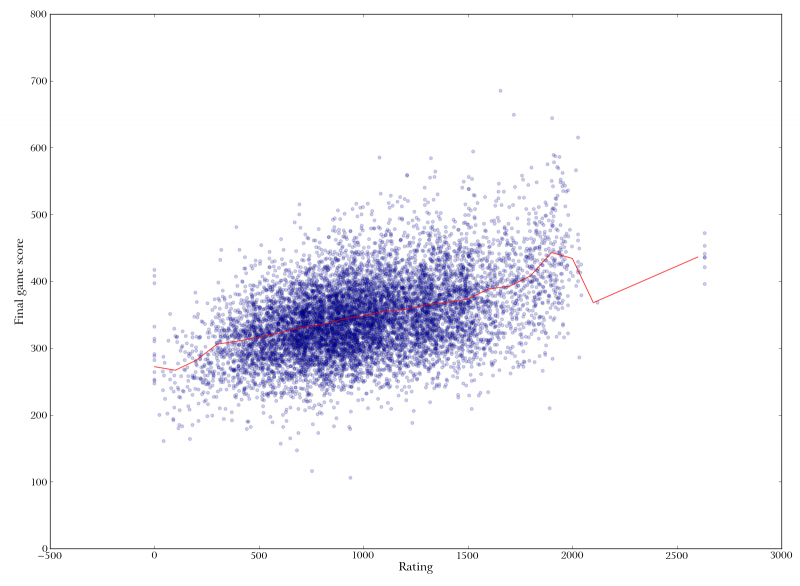
 Scatterplot of player rating versus final score in game. Unsurprisingly, higher-ranked players score more. The correlation is not as strong as you might think, though (Spearman's rho is 0.42).
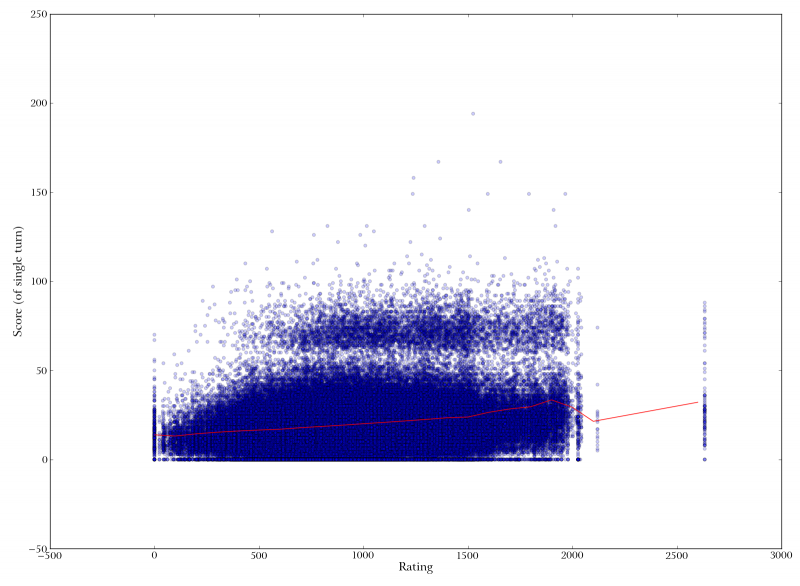
 Player rating versus individual turn score. Each point represents a single play, with the x-coordinate being the rating of the player who played it, and the y-coordinate being the number of points it was worth. Note the "bingo line" just above 50 points. Note also that the correlation between rating and score is relatively weak (Spearman's rho is 0.2).
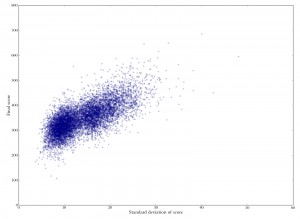 Standard deviation of individual turn scores versus final game score. Each dot represents one player. It looks like higher standard deviations (e.g., a more varied mix of scores) are associated with higher overall scores.

So yeah, I got 4625 Scrabble game logs. What are the overall patterns?
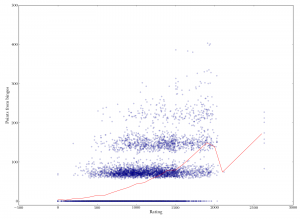
The popeye (graphic box) at the right shows three basic scatterplots. (Click on the image to expand.) These plots also illustrate the two basic ways you can analyze the data: either by individual plays, or aggregated by game. To do the latter, I lumped together all plays made by a given player in a given game and computed some stats on those lumps.
The first image on the right plots each player’s rating against their final score in a game, so each point on this graph represents one player in one game. Unsurprisingly, higher-ranked players tend to score more in a given game. The correlation isn’t as strong as you might imagine, though; there are plenty of games where high-ranked players score low or low-ranked players score high.
The second image correlates each player’s rating against their score on an individual play, so each point represents an individual turn. And right away we see what is crazy about Scrabble scores: the bingo is everything.
A “bingo” is the Scrabble maven’s term for a player using all seven of your tiles. This gets you a 50-point bonus to your score. On the graph, you can see that this rule creates a “bingo line”, that horizontal barrier just above 50 points. You can get over 50 points without getting a bingo, but it’s rare, whereas if you get a bingo you’re guaranteed at least 50 points. So there are really two kinds of plays in Scrabble: bingos and non-bingos.
We’ll come back to bingos in a bit. For now, note also that this graph doesn’t have an obvious correlation with rank. There is a slight trend, as shown by the red line ((The red trend lines in all these graphs represent chunked averages in 100-point rating windows: an average was calculated for players with rating 0-100, another average for those with rating 100-200, etc.)), but it doesn’t jump out at you the way the previous one does. This is an interesting puzzle, since it seems to mean that good players’ performance across an entire game is better than you’d expect based on their performance on individual plays.
The third image in the popeye shows a plot of the standard deviation of individual plays against the final score of the game. It looks like games with a higher standard deviation tend to have higher scores, which would mean that it’s better to have a diverse range of scores.
- Scatterplot of player rating versus final score in game. Unsurprisingly, higher-ranked players score more. The correlation is not as strong as you might think, though (Spearman's rho is 0.42).
 Scatterplot of player rating versus final game score. Points are colored according to the number of bingos played. Although higher-ranked players score better overall, the number of bingos matters as much as the rank. If they score one or two bingos, fair-to-middling players can do as well as really good players.
- Standard deviation of individual turn scores versus final game score. Each dot represents one player. It looks like higher standard deviations (e.g., a more varied mix of scores) are associated with higher overall scores.
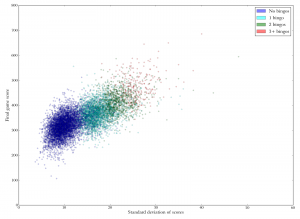 Standard deviation of individual play scores versus final game scores. Each dot represents one player. Dots are colored according to the number of bingos played in the game. It is clear that high standard deviations are largely achieved by playing more bingos.


But here’s where the bingos come in. The next popeye repeats two graphs from above, but each is followed by a modified version in which the points are color-coded according to the number of bingos played in the game. You can see that a great deal of the variation is really just due to this one factor. In the graph of rating versus final score, you can see that points of each individual color create bands of similar scores stretching across many ratings. This means that even fair-to-middling players seem to do pretty well if they manage to get bingos, whereas even good players don’t do that well if they can’t get enough bingos.
For the standard deviation, the color blobs are almost totally disjoint, meaning that high standard deviations in score are almost always a result of playing lots of bingos. This makes sense given that the lower bound on the number of points you can score is capped at zero. If your point spread is going to have a wide variation, it has to expand upwards.
 Scatterplot of player rating versus points from bingos in a given game. There is a marked increase due to better players making more bingos on average. Spearman's rho is 0.47.
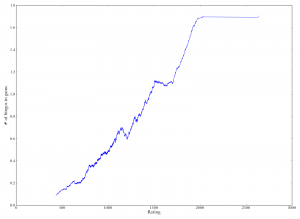 Rolling mean of number of bingos, grouped by player rating. As the rating increases, the mean number of bingos by players with roughly that rating increases.
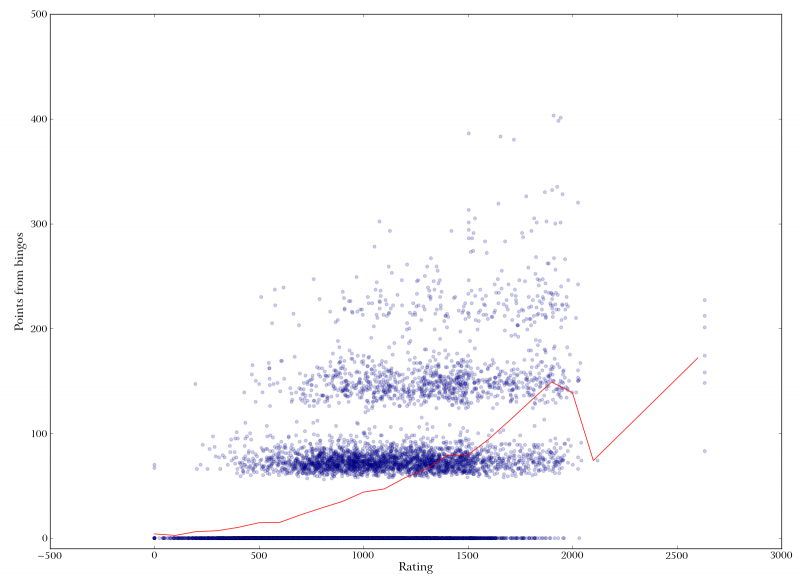

The two images in the popeye at right explore this bingo business a bit more. The first is a scatterplot of each player’s rank against the number of points that player got from bingos in a single game. The points are clearly divided into horizontal bands, because you tend to get roughly 60-70 points per bingo. Each higher band is shifted further to the right. This means that better players tend to get more bingos.
Notice, though, that there are still plenty of dots in the lower bands even towards the right of the graph: in other words, plenty of games where even really good players managed to get only one bingo. Because bingos are discrete (you can get one bingo or two, but not “one and a half bingos”), a better way to put it might be that better players have better chances of getting bingos. The second graph shows a rolling average of number of bingos for players with different ranks; basically this shows the trend for how the number of bingos increases as rating increases. It’s clear that better players, on average, get more bingos.
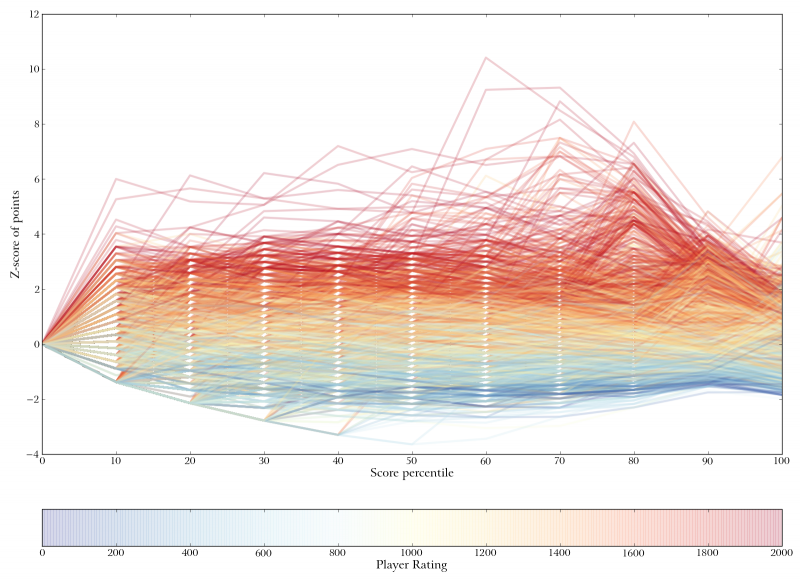
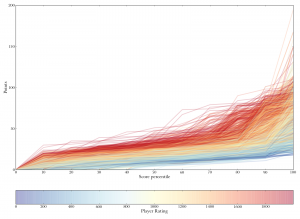 Score growth by percentile. Each line represents one player, with the color representing the player's rank. Each line traces the growth of that players score from their worst plays (10th percentile) to their best (100th percentile). Note how the separation between colors decreases at the last few percentiles, indicating that, while many players can make one great play, the really good players can make multiple great plays.
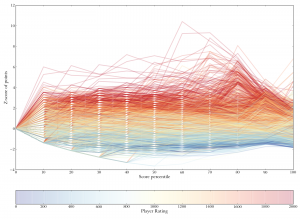 Z-scores of plays at various percentiles. Each line represents one player, with the color of the line representing the player's rank. X-axis represents percentile (e.g., "40" means the score at each player's 40th percentile). Y-axis is in z-scores normalized to the overall mean at each percentile. The large jump at 80th percentile, and smaller jump at 90th percentile, indicate that what differentiates good players is their ability to make more super-high-scoring plays (i.e., bingos).

Of course, this doesn’t tell us how much the bingos “matter” in terms of their contribution to good players’ success. Maybe good players are pretty good even without bingos. To explore this question, look at the plots in the popeye at right. In these plots, which I’m going to call “streak plots” ((I don’t know if this is an actual thing, I just came up with it.)), each line on these plots represents one player in one game, and the lines are colored according to the player’s rating, with bluish lines for poor players, yellowish for middling players, and reddish for good players. The streak plots break down each player’s plays over the course of the game into percentiles, so on the left you have each player’s worst plays, in the middle you have their middling-good plays, and at the right you have their best individual plays.
The reason I like this streak plot is that by looking at the degree of mixture among the colors, you can get a sense of the degree of separation among player skill. You can see that in the 20-50th percentile range, the colors are fairly separated; there’s not a lot of yellow streaking into the red area or anything. This means that good players are notably better than bad players at getting a decent amount of points even from their so-so plays.
In the last three places (80th, 90th, and 100th percentile scores), you start to see different behavior. There’s a noticeable jump in the red lines at 80%, then the oranges jump up too at 90%, and then at 100% all the colors are smeared and you can hardly see where the reds are. What does this mean? It means that at the top end, good players and medium players aren’t that different. Since the top end is bingos, this means that for both good and medium players (and even some pretty crappy players), their best play is a bingo. This in turn means even medium players can get at least one bingo in a game. But where the really good players stand out is in having even their second- or third-best plays also be bingos ((The average game in my dataset has 17 plays per player, so on average each 10-percentile region represents about 1.7 plays. In other words, a player’s 90th percentile score represents his 1.7th-highest play. (However, it will tend be represent slightly more for games with a lot of bingos, because playing more bingos uses up more tiles and thus usually means taking fewer turns overall.) Using percentiles allows comparison between games of different lengths. I should note, though, that the percentiles here are not interpolated. So a given player’s 90th-percentile score is the score of the play he actually played that was closest to 90% of the way from his worst to his best score. I did not (as some percentile-calculation methods do) linearly interpolate if no score fell at exactly the Nth percentile; instead I took the closest actual score. I think this is important, because the difference between plays, especially at the high end, is quite nonlinear.)). In other words, good players get more bingos.
The second graph in the popeye shows the same thing, but with scores normalized to the overall mean instead of being given in raw points. You see the same pattern, here as upticks towards the right. The spike at 80th percentile is big: a really good player’s third-ish-best score is a lot better than a just-okay player’s third-ish-best score — probably because the really good player got three bingos, so his third-best play is over 60 points, whereas the just-okay player got only one bingo, so his third-ish best play is only like 30 points or so.
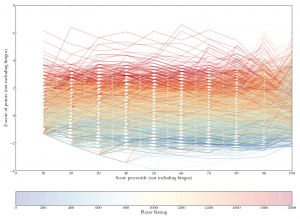 Z-scores of scores at 10 percentiles. Each line represents one player, and the color of each line represents that players rating. On the x-axis, e.g., "40" indicates a given players 40th-percentile score. Y axis is in z-scores (standard deviations from the overall mean Nth-percentile score). Separation among colors is greater at the lower percentiles, indicating that good players make better bad plays.
 Rating versus mean score of non-bingo plays. Better players are better at getting more points, even when bingos are taken out of the equation. Spearman's rho is 0.48.

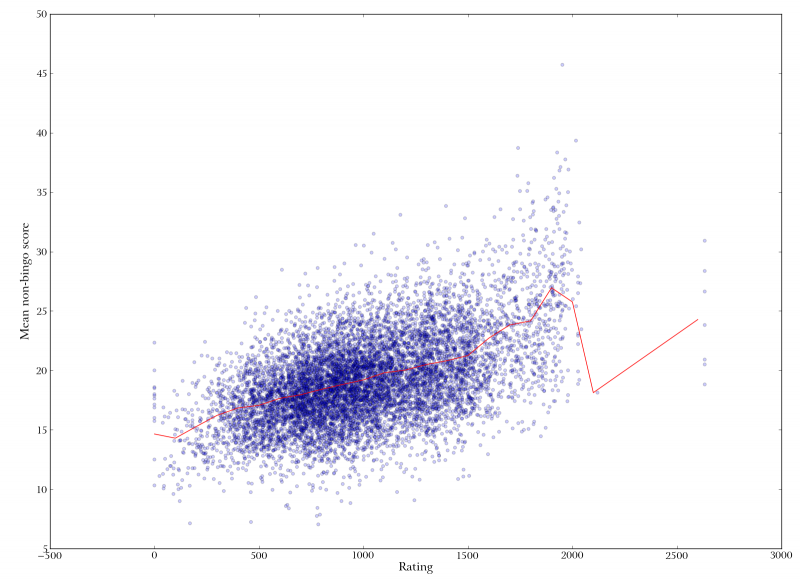
But let’s go back and look at those non-bingos. Are good players good just insofar as they get bingos? Not quite. The first graph in the popeye at right shows the same type of z-score-standardized graph for percentile scores not including bingos. Although the separation between colors is less clear overall, it’s still there; the red lines are consistently on top most of the way across. Toward the right end, there’s more mixture, apparently indicating that even just-okay players can make a few big non-bingo plays. The second graph is scatterplot of each player’s rating against their mean non-bingo score. There’s a definite upward trend.
Bingos and non-bingos
What these results seem to show is that good players are good at two things: getting bingos, and squeezing a few extra points out of low-scoring plays. Medium-good players can get a bingo or two, and they can also score highly on one or two non-bingo plays. But at the low end, when they’re not scoring that much, they’re, well, not scoring that much. Good players, though, still manage to do incrementally better even when playing a not-so-good play.
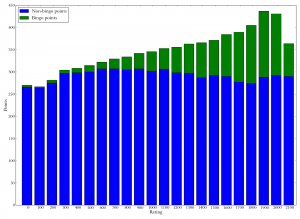 Bar graph of rating versus point distribution. Each bar represents players whose rank falls in a certain range ("0" is players whose rank is 0-100, "100" is players whose rank is 100-200, etc.). Blue bars represent the average non-bingo points per game among those players; green bars are the average bingo points per game. Virtually all of the increase in total points from low- to high-ranked players is due to an increase in bingo points.
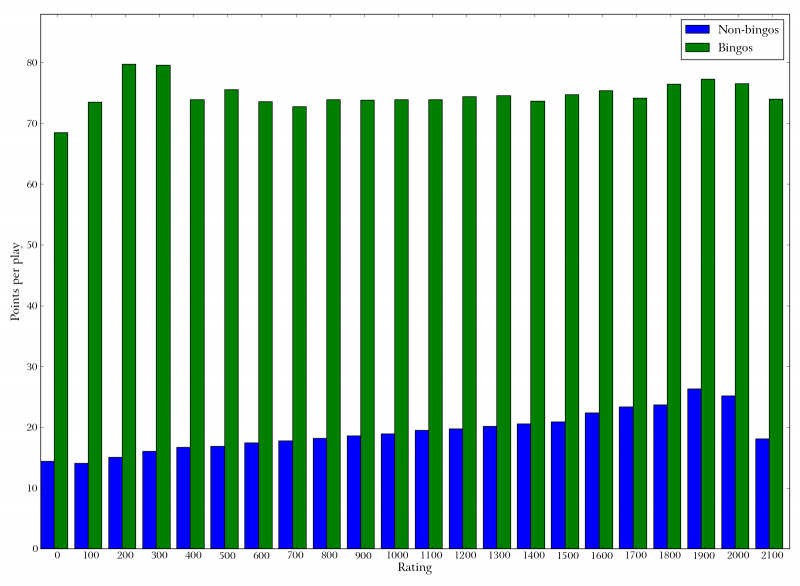
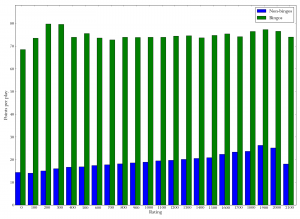 Bar graph of rating versus mean points per play. Each bar group represents players whose rank falls in a certain range. Green bars represent the average number of points per bingo, blue bars the average number of points per non-bingo play. Good players get no more points, on average, from an individual bingo than poor players, but they do get more points from a non-bingo.

The first graph in the popeye at right nicely summarizes this by giving bingo and non-bingo points for the average game, grouped by rating. So on the left, the first bar stack represents the average player whose rating is abysmally poor, between 0 and 100. In a typical game, this kind of player gets about 260 points from non-bingo plays, and that’s about it; players this bad rarely get bingos and so get almost no points from them. The overall height of the blue-green stack represents the total number of points earned in a game. You can see that, after an initial increase up to about rating 600, virtually all of the increase in total points comes from bingos. In fact, for really good players, their non-bingo points go down slightly. Presumably this is at least partially because they’re using up all their tiles on bingos and don’t have many turns left for non-bingos.
The second graph shows the same thing, only here it’s for the average turn instead of the average game. This graph shows almost the reverse picture: the number of points you get per bingo is essentially constant no matter how good you are, while it’s the number of points you get per non-bingo that increases.
This explains why overall performance is not that strongly correlated with performance on an individual play: an important part of overall performance involves the relative distribution of different types of plays. Although it’s true that good players make incrementally better low-scoring plays, it’s also true that they make a larger number of really high-scoring plays (i.e., bingos). In other words, good players get good at making more good plays but better bad plays. They don’t get any more points per bingo than anybody else, but they play more bingos; they do get more points per non-bingo than other people, but not a huge amount more. It seems to be a combination of those factors that’s important.
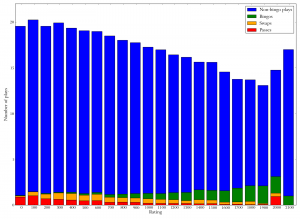 Bar graph of rating versus play distribution. Each bar stack represents players whose rank falls in a certain range. Blue bars show the number of non-bingo plays per game (e.g., the player laid down between 1 and 6 tiles). Green bars show the number of bingos per game. Orange is number of turns used in swapping tiles, and red is number of turns passed (without playing or swapping). Good players play more bingos, and hence fewer non-bingo plays.
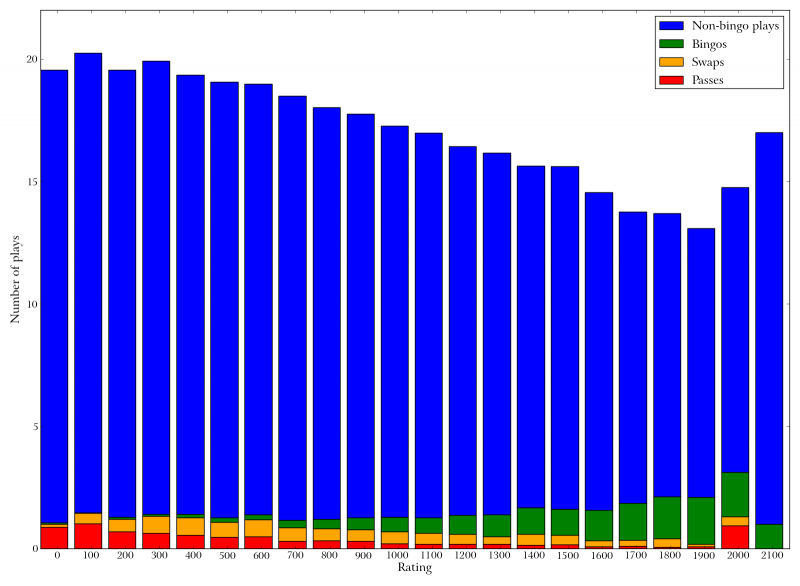
The graphic at right shows how this plays out in terms of what kinds of plays different players make. In each bar stack, blue represents non-bingos, green represents bingos, orange represents swaps (giving up your turn in order to exchange some of your tiles), and red represents passes (passing your turn entirely, without playing or swapping). You can see that the green block increases in size as rating increases, and the blue one shrinks, meaning players are playing more bingos relative to non-bingos. (The decrease in non-bingo plays looks disproportionately large because bingos use up more tiles than non-bingo plays and thus end the game more quickly.)
Good players also cut down on swaps, which I attribute to good “rack management” — that is, making smart plays so that the tiles you have left over give you a decent chance of making a good play on the next turn. It seems that good Scrabble players pay attention to this, and avoid, for instance, playing a move that will leave them with only vowels or only consonants; this is dangerous because it means that a bad draw could leave you with no appealing options on your next turn. (I had no simple way to assess rack management with this data, because it seems to be intertwined with difficult-to-operationalize factors like the crampedness of the board position and the accessibility of bonus squares.) You usually feel the urge to swap when you have all consonants or all vowels (or nearly so), and good rack management makes that less likely.
The graph also shows that as rank increases, passes drop down to almost nothing. (I suspect they don’t drop quite to nothing because there’s no way to avoid the occasional bad luck of being stuck with one or two unplayable tiles at the very end of the game, and you might have to pass your last turn if that happens.)
Two-letter plays
One other thing I wanted to explore with this data is this business about two-letter plays. You often hear people say — well, “often” in relative terms, like a high proportion of the time you’re involved in a conversation with the sort of maniac who writes long blog posts about Scrabble statistics — you often hear people say that learning and using the two-letter words is key to Scrabble dominance. I haven’t seen any numbers on that, though.
A related issue is that of making what I’m going to call “crosses”. This is where you play a word in one direction so that it connects with existing tiles parallel to your play, to make words in the other direction. It seems like mostly when people talk about using two-letter words, they’re talking about using them in this way. It’s generally not that useful to just throw down a word like BA all by itself, but it can be useful if you can get BA as a “side benefit” by playing BUNGLE alongside an existing A on the board. Two-letter crosses are really just a special case of the more general kind of crossing (e.g., you can do a three-letter cross by playing BUNGLE alongside an existing LA so you make LAB in the perpendicular direction).
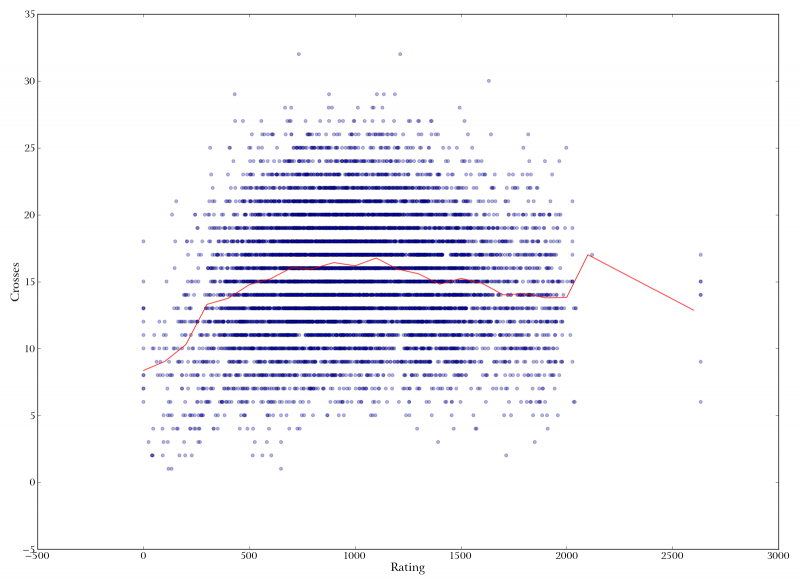
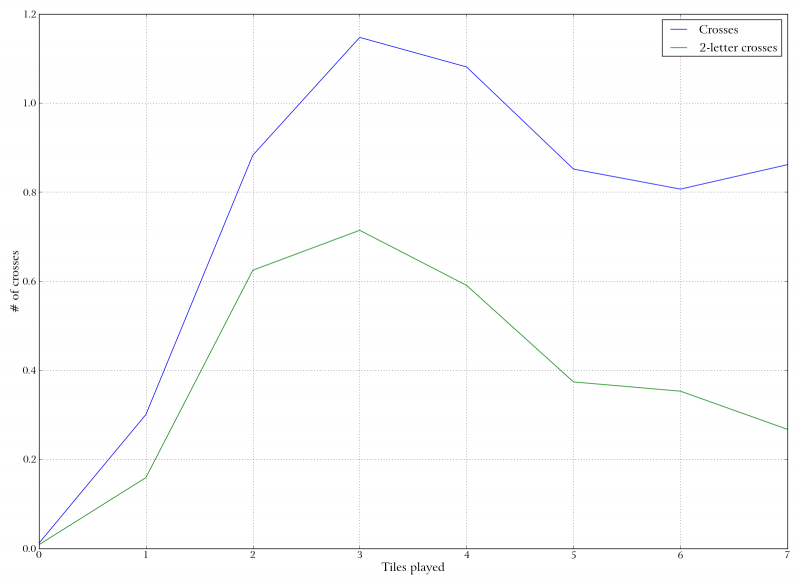
 Rating versus number of crosses in the game. (The number of crosses is the number of tiles in a play that make parallel cross-words with existing tiles.) Medium players make more crosses than crappy ones, but then it declines.
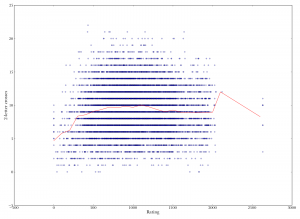 Player rating versus two-letter crosses (playing parallel to existing tiles to make two-letter words). Medium players make more two-letter crosses, but after that it declines slightly.
 Tiles played versus number of crosses (that is, connecting with words perpendicular to the main word to make "crosswords"). Number of crosses is highest for mid-length plays, meaning that players who play the longest words on average will tend to have fewer crosses.
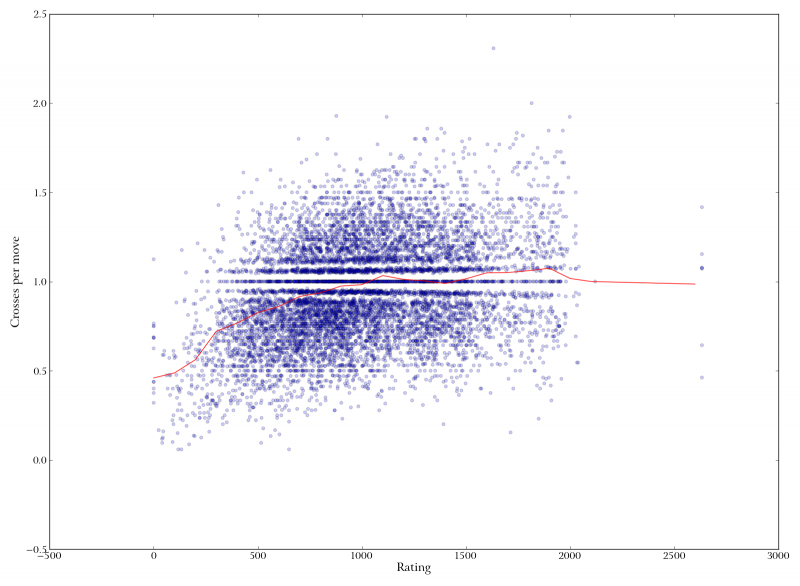
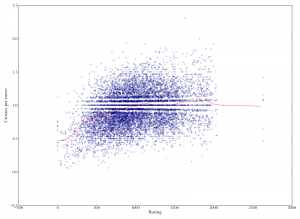 Scatterplot of rating versus number of "crosses" per move. Crosses are when you play parallel to existing words. Better players make more crosses per move, but the increase from medium to good is pretty slight.
 Rating versus two-letter crosses per move (making a two-letter play by playing parallel to existing tiles). As with crosses in general, there is an overall increase, but it nearly levels off after middling rank.


I looked at this by writing a simple program that “plays out” each game computationally and looks at the neighborhood around each played tile. I counted the number of words that were made perpendicular to the main orientation of the play, and how many of those were two-letter words. The popeye at right shows some graphs related to this.
The first graph shows the number of crosses made in a whole game, plotted against the rating of the player. The second shows the same, but for two-letter crosses only. In both cases, the results don’t seem like a ringing endorsement of two-letter plays, or crosses in general. There’s an increase from crappy players to medium players, but then a slight decrease for good players.
However, one possible reason for this is that it’s harder to make a lot of crosses when you’re making long plays. The third graph illustrates the relationship between number of tiles played and number of crosses. The number of crosses peaks when the play is three tiles, then drops off. Since better players tend to play more bingos (and longer words in general, although I didn’t go into this here), they may make less crosses. Plus, if you make a bingo, it doesn’t really matter whether you make crosses, since you’re going to get a bootload of points anyway. (It’s still good to make crosses with a bingo if you can, but the point is that if you can play a bingo, you’ll play it no matter what, even if it doesn’t make any crosses.)
The last two graphs show the number of crosses and two-letter crosses per turn, again plotted against player rating. Here the upward trend seems to be maintained even at the higher ranks, although it becomes very faint.
It’s important to note, though, that these results don’t include any information about how many points the crosses earned. This wasn’t possible for me to calculate using the ISC data as-is, because that data doesn’t specify how much of the score came from which “parts” of the play (e.g., the main-line play versus side connections with existing tiles). So I would have had to do a lot more work to basically make a program that would play Scrabble, and c’mon — like I got time for that? I’m a busy man, spending all these hours making scatterplots. The point is, it may be that these crosses are an important component of that gradual increase in non-bingo scores we saw in the earlier graphs. Making a cross can easily earn you an extra two or three points. If you get the right setup it can earn you an extra 10 or 15 points, and if your opponent dares to leave the triple letter score open next to an appropriate vowel while you’re holding the Z or the Q, the cross could net you an extra 30 points or more. These extra points could help good players boost their non-bingo average by a few points per game.
So why do people say to learn the two-letter words? I think one reason is that it’s easy — or at least possible. As we saw earlier, most of the increase in points as your rating goes up is due to bingo points. But it’s just not possible to learn every single bingo word — there are way too many of them. In the SOWPODS dictionary, the number of seven- and eight-letter words combined is more than the total number of all two- through six-letter words. It doesn’t do much good to tell someone to learn all those words. But learning all the two-letter words is a manageable task, so it makes sense to do that if you want to get good at Scrabble — not necessarily because it will give the most benefit, but it may give a good amount of benefit relative to the amount of work required.
Another possibility is that the “learn the two-letter words” advice is targeted not at okay players but at really bad players. It’s clear from the graphs above that the increase in crosses (including two-letter crosses) is steeper between low- and medium-ranked players than between medium- and high-ranked players. So learning two-letter words might be a way to bring your game out of the cellar and at least up to ground level.
Word frequencies
The clearest way to distinguish the dyed-in-the-wool Scrabble player from the dilletante is that the dilettante cares what the words mean. I’m not knocking playing Scrabble just for the fun of playing dirty words, or squandering your blanks just for the thrill of playing JAZZ, or throwing caution to the wind and adding an E to SQUIRE to make ESQUIRE even when it sets your opponent up for the triple word. But you don’t win that way. Everybody knows that to win Scrabble you have to make your peace with playing lots and lots of words that no one ever, ever uses in any context other than Scrabble. When was the last time you heard someone say “za”? “Qi”? “Aeolian”? “Muzjiks”? Have you even read them recently in a newspaper? Or a novel? I didn’t think so.
Given that, it doesn’t really make sense to try to measure Scrabble words by how frequent they are in non-Scrabble contexts. I did a quick look to check: of the 150,000+ plays made in my data set, more than half are words that occur zero times in the Brown corpus, which is a standard resource for English word frequencies. Words like teek, vly, uta, unagile, and dugong. It’s not all of these are totally insane — I know what a dugong is, and I think we can all figure out what unagile means — but they’re just so vanishingly rare in actual usage (spoken and written) that it’s almost impossible to get meaningful statistics on them.
What I decided to do is maybe more interesting anyway: I decided to look at the frequency of words within Scrabble plays. In other words, rather than looking at how frequent a given word was in some ordinary corpus, I decided to look at how frequent it was within my own dataset of Scrabble plays.
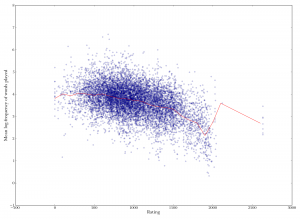 Player rating versus mean log-frequency of words played. Word frequencies are ranked relative to the overall frequency IN SCRABBLE GAMES, not frequency in real-life usage. There is a decrease in frequency with higher rank, meaning that better players play less-commonly-played words. Spearman's rho is -0.39.

On that front, the graph at right is basically all I’ve got. It’s a scatterplot of each player’s rating versus the mean log-frequency of the words that player played. (Where, again, “frequency” is defined as the number of times that word was played by anyone in the dataset.) It shows, unsurprisingly, that better players tend to play less common words, on average.
I think this is actually more interesting than the corresponding statement about real-world frequencies. Saying that Scrabble players play words that people don’t use outside of Scrabble is, in the words of a rabbi we once quoted in my high school newspaper, “kind of a duh thing”. Even pretty unimposing Scrabble players can throw down a QI or a CWM or a VUM without batting an eye. But what this graph shows is that good Scrabble players play words that even other Scrabble players don’t use.
Obviously this has to be interpreted with a grain of salt. Any individual game is only a tiny slice of a given player’s “Scrabble vocabulary”, so what this probably really means is that better Scrabble players just have a larger repertoire of weird words they know. It’s not that good player’s don’t play common words, it’s just that they also play uncommon words.
This is especially true in bingos, no doubt. Because the number of long words is so much greater than the number of short words, people who play a lot of bingos kind of have to know more words. The most frequently-played words are all short words — most of them two letters — because, obviously, there aren’t that many possible combinations of two letters. Any given two-letter word you play is likely to be one that you played in the last few games — maybe even once already in the same game. But when you play a bingo, it’s more often going to be a one-of-a-kind that you haven’t played recently and won’t play for quite some time. So the lower average frequency of words played by good players may reflect the fact that they play more longer words, of which there are a greater variety available.
Luck
One last thing I wanted to investigate is the extent to which the luck of the draw influences the outcome in Scrabble. Like it or not, you can’t control what tiles you draw (unless you cheat), and, like it or not, some combinations of tiles are more conducive to making points than others.
It may be some consolation to the weaker Scrabble players among my readers to know that luck does seem to matter — a bit. I first looked at this by computing the “total tile score” of each player in each game; this is the sum of the face values of all tiles that player played in the course of the game ((Note that it’s all tiles played, not all tiles held. If you swap a tile or are still holding it at the end of the game, it doesn’t count toward your total tile score.)). So if you play a J, it contributes 8 to your total tile score, even if you play it on a triple letter square. The total tile score in some represents “what you have to work with” pointswise.
You might think that total tile score wouldn’t matter that much. After all, if as we saw before, making bingos is where it’s at, what do you need those high-point tiles for? They don’t make it any easier to make a bingo — in fact, they can make it considerably harder — and the amount of points they add to a bingo score is typically puny compared to the 50-point bonus. Be that as it may, the mean total tile score of game-winners (that is, people who won their game in the data set) was, in my data set, about 10 points higher than the mean total tile score of game-losers. In other words, people who won had, on average, 10 more points to work with, in terms of the tiles they were dealt, than did people who lost. This isn’t a super huge difference (especially considering that the mean margin of victory was about 55 points), but it’s something.
 Scatterplot of total tile score against final game score. "Total tile score" is the total face value of all tiles played by a player during a game. The luck of the draw matters: playing higher-scoring tiles increases your score. Spewarman's rho is 0.45.
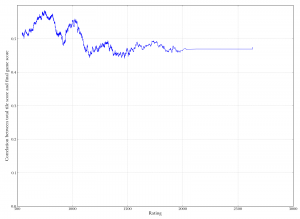 Rolling correlation between total tile score and final game score. On the x-axis is rating. The y-axis measures the correlation between the value of tiles the player played, and the player's final score in the game. The correlation decreases slightly over time, indicating that good players get better at scoring well even with poor tiles. But it's still pretty high overall, meaning that luck still plays a significant role.
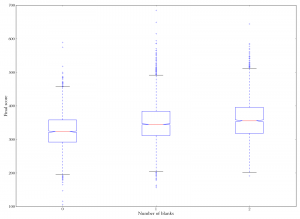 Boxplot of number of blanks used versus final score. Players who got more blanks scored higher on average.
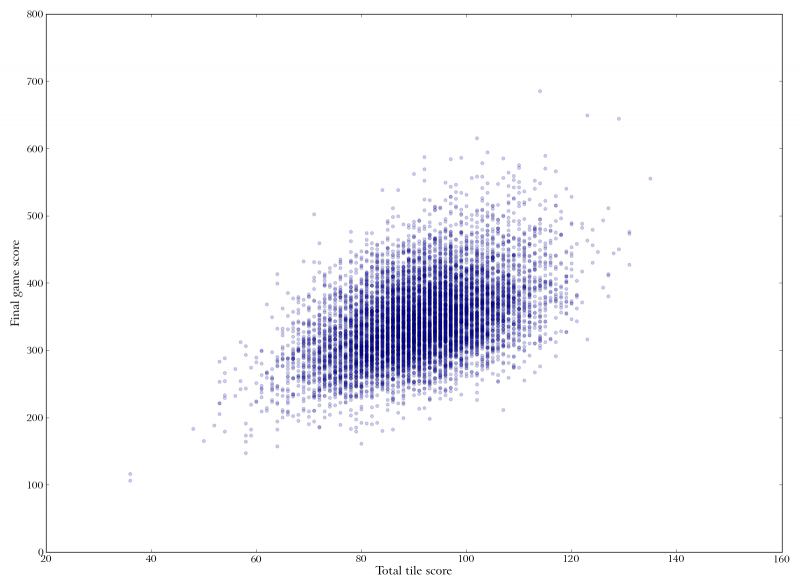
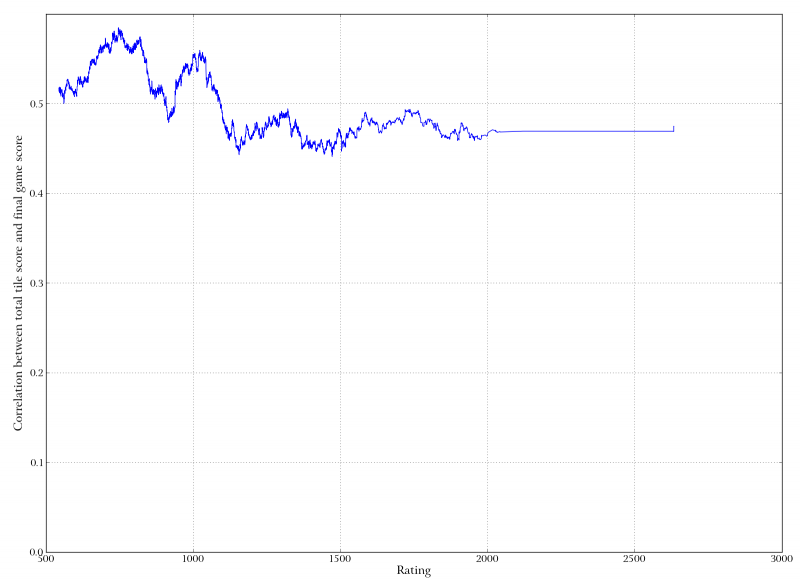

The graphs at right show a bit more on this issue. The first is a scatterplot of total tile score versus final game score — how many points were on your tiles, versus how many points you actually earned by playing them. The trend is clear: getting more tile poiints increases your score. The second graph is a correlation of these two numbers, taken in a rolling window by rating. So it looks at people around a given rating and looks at the extent to which their total tile scores were correlated with their actual game scores. It does decreases somewhat at first, indicating that really poor players rely more on the luck of the draw, but then it flattens out and remains at a fairly high level.
One thing conspicuously left out of the total tile score is blank tiles. Blanks have a face value of zero, so they contribute nothing to total tile score, but obviously they’re very helpful, and whether you get them is basically pure luck. The third graph in the popeye is a boxplot of number of blanks versus final game score. Sure enough, players who got more blanks scored higher overall. Interestingly the boost from no blanks to one blank seems to be bigger than from one blank to both blanks (roughly 24 points versus 11 points). Anyway, here again we see that luck matters. ((There are some complications with calculating the number of blanks held or played by each player due to the format of the data from ISC, so it’s possible these numbers are very slightly off due to strange corner cases where people made repeated plays across the same blank tile once it was down.))
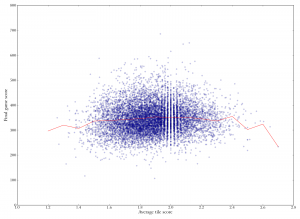 Scatterplot of average tile score versus final game score. The correlation is tiny (Spearman's rho is 0.09), indicating that better players do not rely on luck to score well.
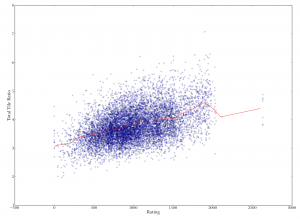 Rating versus total tile ratio. There is an increase over time, indicating that good players tend to get more points out of the same tiles, on average. Spearman's rho is 0.42.


Edit: As Jake correctly pointed out in a comment, my analysis of total tile score doesn’t take into account the fact that better players tend to player longer words, and thus draw more tiles, which would increase their total tile score. Thus, it may be that being better causes you to have a higher total tile score, rather than the other way around.
It looks like Jake is right. The first graph at the right shows the average score per tile — that is, the total tile score divided by the number of tiles played — plotted against final game score. Here the correlation between luck and outcome is very tiny.
I realized I also had another graph supporting this view that I forgot to include initially. It’s the second one in the popeye at right. This plots each player’s rating against their “total tile ratio” — the ratio of their actual score to their total tile score. This in some sense measures their “force multiplier”: how many points they were able to squeeze out of the tile score they were dealt. You can see that it increases, meaning that better players are better at getting more points out of the same tiles.
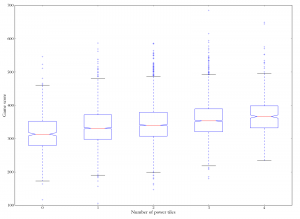 Boxplot of number of power tiles (Z, Q, J and X) against final score. Getting more power tiles tends to increase your score.
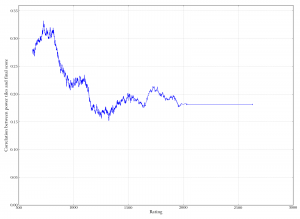 Correlation between power tiles and final score, calculated in a moving window by player rating. The correlation decreases with rank, indicating that better players' scores are less determined by getting power tiles (Z, Q, J, and X).
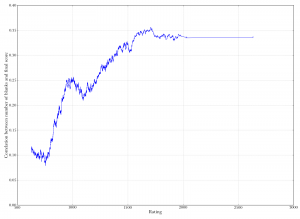 Correlation between number of blanks and final game score, calculated in a moving window by player rating. The correlation increases with higher rank, indicating that for better players, the luck of getting a blank matters more.
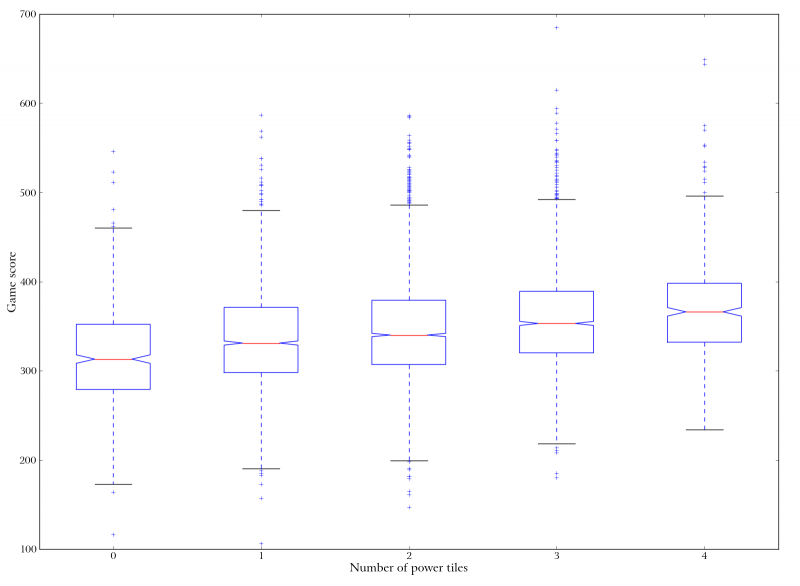


One other thing I didn’t look at before was whether certain tiles matter more. Specifically, some people care a lot about the “power tiles” — X, J, Q, and Z — which are worth 8 or 10 points each. (I didn’t include K, which is worth 5 points, as a power tile, although you could argue for it since, like the others, it’s a tile of which there is only one in the bag.) The first graph on the right is a boxplot showing the score distribution according to the number of power tiles played, zero through four. Getting more power tiles increases your score.
The second graph shows the correlation of power tiles with score, calculated in a moving window by player rating. So it shows how the link between power tiles and score changes as skill increases. The correlation drops by about half, indicating that getting better involves relying less on luck (although it still plays a role).
However, there is one final caveat about luck: it seems that for good players, the luck of drawing blanks matters more than it does for weaker players. The third graph shows a similar rolling-correlation, but here the correlation is between number of blank tiles and final score. The correlation increases substantially with rating, indicating that for good players, the luck of getting blanks really matters.
I imagine that this is because blanks, unlike power tiles, help you get bingos. In fact, a blank tile helps a lot with getting bingos. Since better players tend to rely more on bingos to increase their score, it would make sense that the blanks are more important to them.
Conclusion
My main conclusion from this project, as with so much that I do, is that it is a lot of fun to fiddle with numbers and make graphs. In this case I had the added fun of writing a bot to slurp the Scrabble data from the ISC server. Fun was also increased because I started using the delightful pandas library for Python, which has lots of nifty facilities for aggregating and slicing data in various ways.
But what about conclusions for Scrabble? I guess these would be my recommendations based on what I found here:
- Play bingos. Duh! But really, according to what I found, almost all of the increase in total points that separates good from bad players has to do with playing more bingos, on average.
- Keep it steady. In other words, don’t get lazy on the small plays. Look for ways to make crappy plays into less-crappy plays, and less-crappy plays into okay plays. The results suggest that an important component of good play is squeezing as many points as you can out of even your less-impressive plays. The good players stand out even in their lower-scoring moments.
- Do not swap tiles. One obvious bingo-focused strategy would be to go all-or-nothing, swapping tiles frequently in order to get a collection of tiles that lets you make a bingo. The results here do not support this strategy: better players swap less, on average, than worse players.
- Go ahead and learn the two-letter words. This is less well borne out by the data, but there was a correlation between two-letter crosses per play and overall rank. Plus, “learn two-letter words” is advice that’s a lot easier to apply than “play more bingos”. It also seems that learning two-letter words may be especially helpful if you really suck: the increase is sharper between poor players and medium players than between medium players and good players.
- Throw the board against the wall denting the wall and the board prior to uppercutting your opponent when all else fails.
Of course, all the results here are correlational rather than causal. It’s possible that bingos don’t help you win, but that good players coincidentally drink magic kool-aid that epiphenomenally causes them to play lots of bingos. Unlikely, in my view
The most interesting result to me is how much the bingo seems to matter. Everyone knows it’s important, but the impression I get from this analysis is that it’s pretty much all-important. If you can’t consistently score one bingo per game, you’ll have difficulty competing with pretty-good players; if you can’t consistently score two per game, you can’t compete with the really good players. (Of course these are just “really good” players in the context of internet Scrabble. Presumably you need even more chops to compete in tournaments or the like.)
The reason this is interesting to me is that the bingo rule is possibly the most arbitrary part of Scrabble. . . OR IS IT??? It just so happens that 50-to-60-ish points is about the upper limit of what you can hope to score with a non-bingo play, and that’s also the lower limit of what you’ll score with a bingo. This creates a very clean divide between bingos and non-bingos. I wonder if old Alfred Butts planned it that way. (Alfred Butts was the guy who came up with Scrabble. In addition, his last name is Butts. That’s an important part of his appeal.) If you look him up you can find a lot of references to how he calculated the letter frequencies by reading the New York Times, but I haven’t been able to find much about how he decided on the rest of the rules.
In any case, the bingo divide means that, above a certain level of play, that 50-point bonus pretty much defines the game. In my data, if one player has one more bingo than their opponent, they are more than three times as likely to win; if they have two more bingos, they are nearly 10 times as likely to win.
In a way, this seems unfortunate to me. It would be interesting to play variants of Scrabble where the bingo bonus was set to a different number of points. If it were only, say, 25, its impact would be greatly reduced, since you could reasonably get “a bingo’s worth” of points with an ordinary play. (I guess on the bright side, if the bingo bonus were much more than it is — like if it were 75 points — it would become almost impossible to recover from someone scoring a bingo against you.)
The other interesting thing about the bingo is that it’s all or nothing. It separates plays where you use all your tiles from plays where you use anything less than all of your tiles. It would interesting to see how the game would be affected if the bonuses were more incremental — like, if you could get 10 points for using 5 tiles, and 20 for using 6 tiles, or the like.
There’s another aspect to this too, which is that the bingo gives you a bonus for using the most tiles possible, but this simultaneously brings the game closer to an end. We saw this in the graphs above showing that, in general, players who play more bingos make disproportionately fewer non-bingo plays. When you use all 7 tiles and draw 7 new ones, you not only get 50 points, but you also get 7 tiles closer to an empty bag. This means that when you play a bingo, not only do you increase your own score, but you effectively shorten the game, giving your opponent less time to catch up. (Of course, if you’re still behind after the bingo, you give yourself less time to catch up; but the fact remains that you are essentially “locking in” a shorter game at a moment that is a local maximum in terms of your rate of score increase, which is clearly a benefit for you, the bingo-player.) So the bingo is a double-whammy that simultaneously gives you a boost and reduces your opponent’s ability to fight back.
So, basically, the bingo bonus is so large and specific that it skews the game radically toward a particular kind of play, namely one that uses all of your tiles. The way it stands now, there’s little incentive to play a 6-tile word instead of a 5-tile word, all else being equal. But the incentive to play a 7-tile word over a 6-tile word — whether all else is equal or not — is so colossal that you will never refuse it: you always play a bingo if you can, no matter what (the only possible question being which of several possible bingos to play). It would be interesting to see Scrabble variants in which the bonus structure was such that you might sometimes pass up a number-of-tiles-related bonus for other reasons — either because you could get more points with a different play, or because positional factors outweighed the loss in points. Just intuitively, it seems like this would make the game more varied and strategic, with more tradeoffs and choices, instead of making high-level play a pure bingo-hunt.
In a future post, I plan to analyze the ISC data from games in other languages. As part of that, I’m hoping to also do some more statistics on the relationship between number of letters in a word and word frequency, to see whether — in English or other languages — seven letters is the “sweet spot” at which it is appropriate to offer a bonus, or whether this really is just an arbitrary choice and some other word length would be better.
13 Comments
Under the “Luck” analysis, there’s one obvious correlation you seem to be neglecting: better players play longer words, and thus over the course of the game will have more tiles, inflating their total in a non-luck-of-the-draw-related way. I imagine the correlation between game score and tile score will be at the very least reduced, and possibly nearly eliminated, if you use average tile score instead of total.
Thanks for a very interesting analysis. Any stats on the correlation between moving first and winning in Scrabble and/or words with friends?
Jack
Hmmm, that’s a good idea, I haven’t looked into that, perhaps I will do that at some point. I don’t have any data on Words With Friends though.
Understand the fundamental rules of the game, learn letter Q words, find out how to identify terms without any vowels, learn to create words with only 2 letters, and practice.
Interesting stuff! I’m curious what the distribution for number of tiles swapped looks like.
Great analysis! thanks.
1. As a bit of an ISC veteran I’d like to make a point about the data you collected. A lot of the games played are 3 minutes per person. Even though only a small share of people play 3-minute per player games, whenever they spend 30 minutes at ISC, they are likely to play many such games. In these games, bingos are a bit more rare, because there is less time to ponder your options. The distinction matters in particular, because really top players don’t play much 3 minute scrabble, preferring instead tournament style 15 minutes /player scrabble. This may skew downwards the results of your middling players (of which I am one).
2. Some ISC games permit you to play ‘phoneys’ and some don’t. I’d be fascinated to see a cut of the data where the total score contributed by phonies was calculated. Being caught playing phones can force passes. This might also account for the high rate of passes among good players.
3. I disagree on the merits of swapping tiles. I interpret the data as saying that that category remains relatively constant across players. Good players are swapping perhaps 70 per cent as often as the very worst players, despite having superior ability to dump vowels. I think swapping may contribute to the higher standard deviation in scores for good players. They’re not afraid to swap when necessary, whereas some poor players don’t know when to swap. I’d also like to see another bias I have confirmed in the data – good players always swap at least 5 tiles, while the mark of a bad player is swapping one tile. If you only need to swap one tile, you don’t have bad tiles!
4. I’m interested in the way board management matters to bingos. I suspect that if there is no bingo played in the first six moves, the chance of a bingo being played falls. playing a long word across the board creates heaps of options for making an 8-letter word, or for hooking on. if you get a clump of 3 letter words in the middle of the board to start off with, you may never get a bingo in that game.
Overall, I really loved this blog post. Am going to comb your archives now to see if there is more good scrabble content!
Is there a way to review a game to see if someone is letting you win?
Thank you so much for this article. I am a casual player, and your presentation of information was definitely user friendly. I also appreciated your sense of humor.
great post on the analytics. My question is, would you release the data to me or the script you used to obtain the data.
Yeah, I can send you the data. My email can be found on the About page of this website (not the blog).
Hola! I’ve been reading your website for some time now and finally got the bravery to go ahead and give you a shout out from Porter Tx!
Just wanted to say keep up the great job!
I’m really inspired with your writing abilities and also with the format in your weblog.
Is this a paid subject or did you customize it yourself?
Either way keep up the excellent quality writing, it’s
rare to look a great weblog like this one nowadays..
I know this if off topic but I’m looking into starting my own blog
and was curious what all is needed to get set up? I’m assuming having a blog like yours would cost a pretty penny?
I’m not very web savvy so I’m not 100% positive. Any suggestions or advice would
be greatly appreciated. Cheers